Click here for a print version of the study
Aon's Homeowners ROE Outlook calculates risk-adjusted returns for U.S. homeowners insurance. Nearly every study since 2002 estimated Florida at negative ROEs compared to the national portfolio. And yet, market reality in Florida is highly competitive with domestic specialists that succeed in attracting capital. This new study answers a simple question. How do insurers who only focus on Florida business view the homeowners market compared to national insurers managing A.M. Best A-rated capital requirements?
Florida insurance dynamics
Personal property risk in Florida might be one of the most challenging insurance markets in the world. Florida homeowners insurance is not expensive due to a catastrophe model or because insurers mismanage their business. Here are some drivers to teh high cost of homeowner insurance.
- The properties are exposed to some of the world’s most severe natural disasters and Atlantic basin hurricanes are not rare. It’s more about the storm(s) severity and if it made landfall
- The strict regulatory environment requires annual rate filings with so much granular detail that the documentation often exceeds 5,000 pages.
- The legal environment is one of the five worst in the country per the 2017 Lawsuit Climate Survey from the U.S. Chamber Institute for Legal Reform.
- Localized non-catastrophe loss issues requiring underwriting and claims expertise, e.g., sinkholes in the early 2010’s and assignment of benefits today.
Florida insurers need to be good at everything because the local market has multiple unique challenges that can quickly erode profitability and threaten solvency.
 The Florida homeowners market is incredibly competitive despite these challenges and engenders new insurer formation with business-friendly regulations. The largest 34 Florida insurers have 90 percent of the market share. We challenge anyone to think of another high-dollar consumer staple – cars, appliances, banking – where 90 percent market share requires more than the top 10 competitors.
Aon's study examines two strategic approaches:
- Domestic Florida specialists make a strategic bet that a carefully leveraged balance sheet and reinsurance protection against more frequent events will result in little net catastrophe risk and double digit returns most years.
- Florida subsidiaries of national insurers inherit a franchise value view of risk from their parent organizations. They buy reinsurance limits against more severe events while holding large amounts of capital and focus on the local (e.g. county-level) markets that are compatible with this deleveraged approach.
The end-consumer certainly benefits from these competing business models. But questions remain if the current political and regulatory environment in Florida allows consumers to truly understand the differentiation.
Florida Specialists
Our study considers specialists as Florida-based and domesticated insurers that either incorporated or rose to significant premium volume in the wake of the withdrawal of the national insurers after the 2004-2005 hurricanes. They are specialists as they found ways to thrive, sometimes profitably, in one of the toughest property insurance markets in the country.
To model the domestic Florida specialists, we aggregated the financial statements and rate filings of approximately forty legal entities representing $6.4 billion of homeowners premium at prospective rate levels. Three characteristics emerge when describing this group:
- High levels of reinsurance utilization with catastrophe protection designed to engage as often as every three years.
- Demotech rated carriers with a focus on capital adequacy based on the NAIC’s risk-based capital (RBC) formula.
- Willingness to write business in high risk counties such as Miami-Dade where Florida Citizens once had more than half the market.
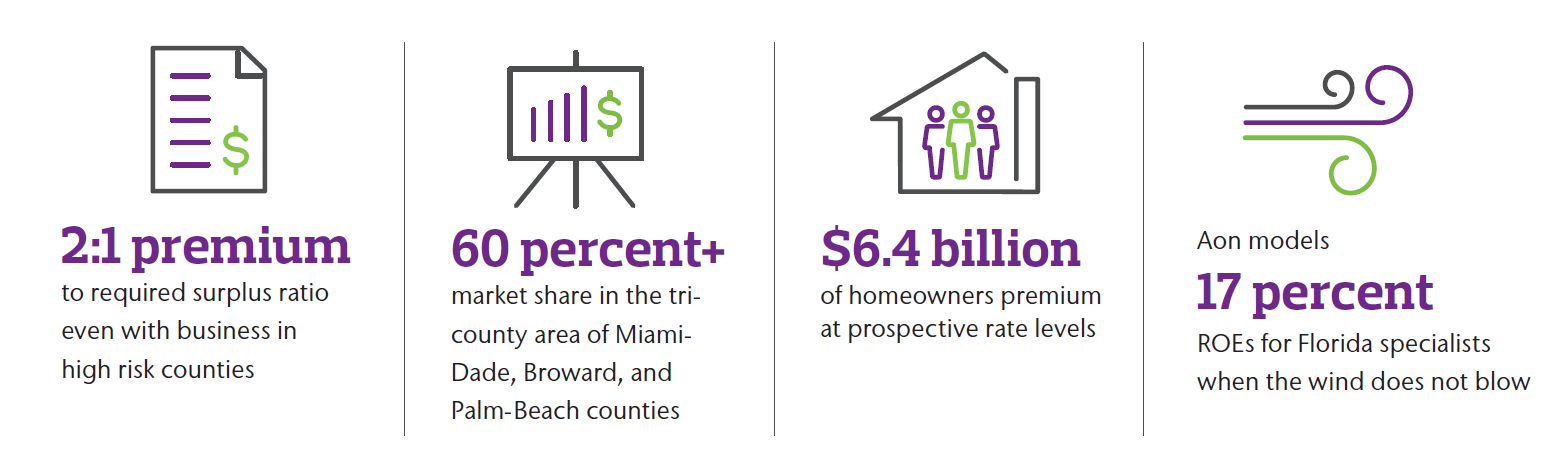
Florida specialists operate near a 2:1 premium to required surplus ratio even with these high risk levels and 60 percent plus market share in the tri-county area of Miami-Dade, Broward, and Palm-Beach counties. Their reinsurance buying stance, which tends towards low attaching occurrence treaties, keeps net loss levels in catastrophe years within a safe margin of available capital. This facilitates higher levels of leverage while still meeting their Demotech rating requirements.
The rewards are theirs to reap. Florida specialists captured two-thirds of the largest personal property market in the U.S. With $6 billion+ of premium volume, we model 17 percent ROEs in years when the wind does not blow. Even with landfalling Florida hurricanes, these insurers can have positive single-digit ROEs (we model 1 to 2 percent) because of the combined protection of the FHCF and private market reinsurance.
While the rewards are bountiful, our study highlights two major risks to this group of carriers beyond the general challenges of the Florida marketplace. The first is the possibility of legal and claims-related issues associated with assignment of benefits, which causes loss inflation and increasing pressure on claims adjustment expense ratios. The second is if hurricane(s) exceed their reinsurance coverage; many insurers might survive a $100 billion industry event but survivability drops precipitously for some on losses above that level.
Florida Specialists
Florida Subsidiaries of National Insurers
Many of the strategic struggles the national insurers face with the Florida market emerged as early as 1992 with Hurricane Andrew. Multi-state insurers realized a large Florida presence could threaten their claims-paying ability across their entire portfolio after a major hurricane. The dominant national insurer strategy for the Florida market, as measured by premium volume, uses Florida-domesticated subsidiaries specifically incorporated to write property business exclusively in Florida on behalf of the parent organization. Their purpose is to provide the parent access to the large Florida market while offering strategic flexibility to respond to the regulatory and risk environment.
The premium volume of these subsidiaries is almost entirely comprised of Allstate (Castle Key), Nationwide, Travelers (First Floridian), and State Farm. We included Progressive’s American Strategic subsidiary in this cohort since their origins as a Florida specialist no longer apply with an A.M. Best rating and access to their parent’s $10 billion+ of surplus capital. These entities represent $1.4 billion of homeowners premium at prospective rate levels. Three characteristics emerge when describing this group:
- High reinsurance exhaustion points with catastrophe protection designed to cover industry events over $100 billion.
- Capital requirements as promulgated by A.M. Best and consistent with a rating of B+.
- Reluctance to write significant premium volume in coastal portions of the state; coastal depends on the carrier.
These insurers have enjoyed a two-pronged benefit from low tri- county (Miami-Dade, Broward, Palm Beach) market share. First is the obvious management of catastrophe risk with limited market share in the most catastrophe-prone counties.
Second, litigiousness and related assignment of benefits impacts are also most severe in this region. As a result, the Florida subsidiaries model to an 85 combined ratio benefiting from both lower attritional loss levels (by dodging assignment of benefits) and lower catastrophe losses.
But is an 85 combined ratio good enough? To achieve an A.M. Best B+ rating, we model premium-to-surplus at less than 0.9 to 1.0. Catastrophe protection for very large events provides comfort but is expensive on an accounting basis because most years it will not be used (i.e. most years won’t have a hurricane severe enough to cede losses to these reinsurance treaties). This means that the modeled underwriting profitability only manages to fund a single digit return that may not be commensurate with the risk the insurers bear and fails to meet the 10 percent return hurdle of our national study.
Ultimately, this cohort shows the patience of their parent organizations. They are strongly capitalized with high reinsurance limits. If or when a monster hurricane tests the claims-paying ability of the Florida specialists, will the market reward this strategic stance?
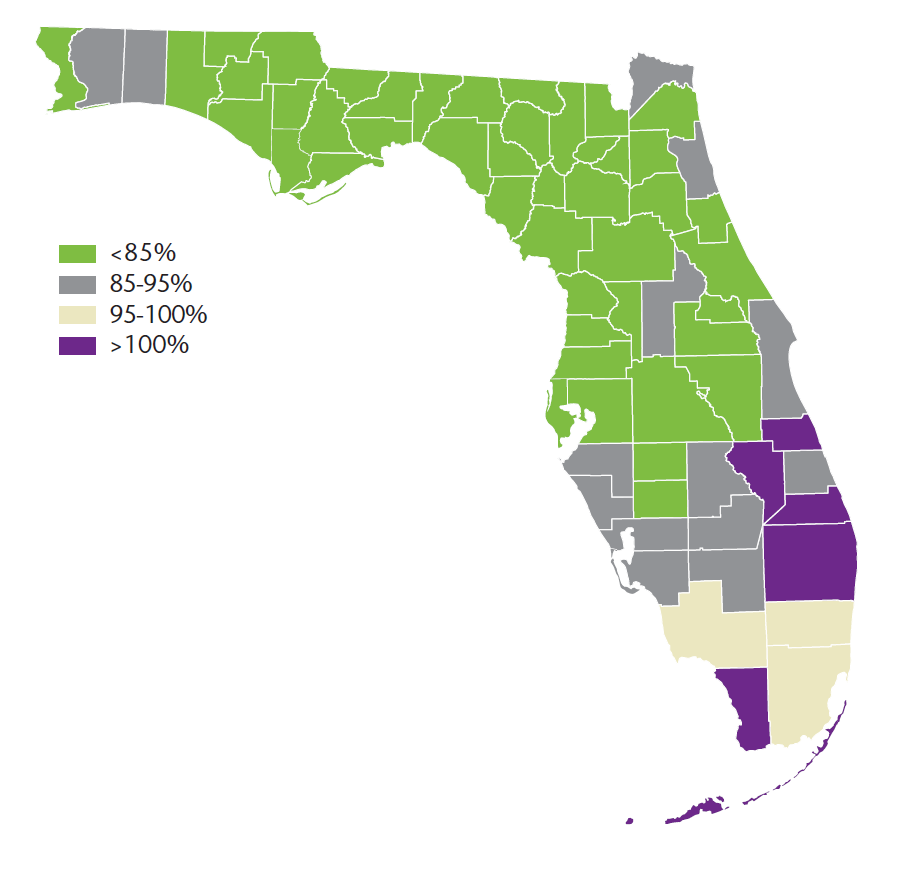
Florida who's who: market share by county and cohort
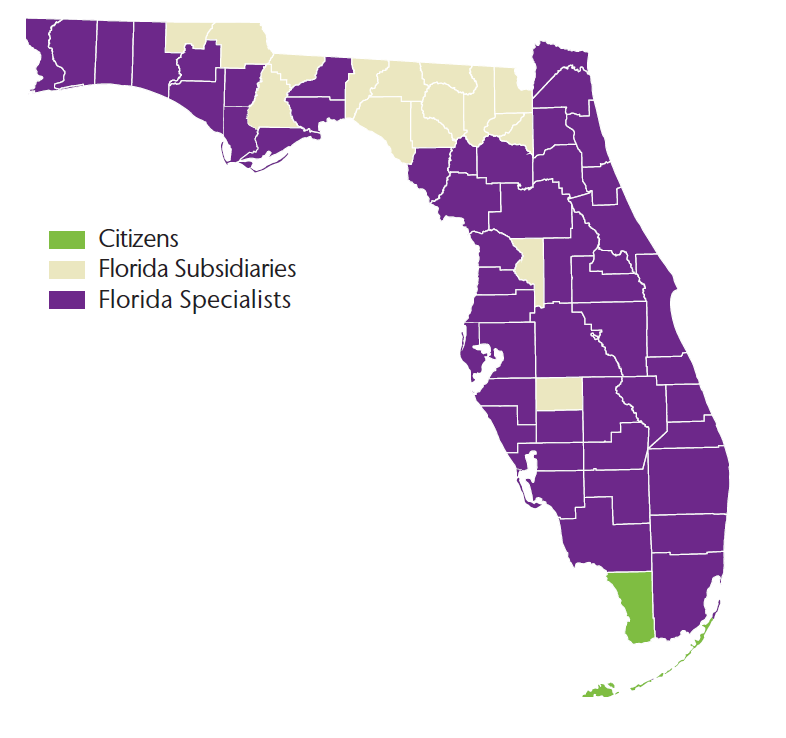
The map shows that domestic Florida specialists dominate most local markets in the state, consistent with their overall statewide premium share of 60 to 70 percent. Florida subsidiaries have the largest share of North Central Florida and a few inland counties; these insurers have generally pulled back from the southern half of the state compared to their 2004 to 2005 positions. Monroe is the only county where specialists and subsidiaries represent less than 25 percent of wind premium. These high risk properties in the Florida Keys represent a market even the most aggressive specialists do not underwrite leaving the majority to Citizens and non-admitted insurers operating with greater pricing flexibility.
This study included 2017 FHCF Data provided by Gina Wilson, FHCF Senior Director of Operations & Examinations, State Board of Administration of Florida, on March 28, 2018.
The prospective combined ratio calculation substitutes catastrophe experience with a multi-model view of loss, estimates impact of assignment of benefits, on-levels historical premiums to prospective levels, and incorporates expense levels consistent with annual statement reports.
Assignment of benefits’ results are available by region. Palm-Beach, for example, receives the same assignment of benefits affected loss ratio in our study as Miami-Dade. This likely distorts results from actual.
Model adjusted prospective combined ratios for Florida specialists
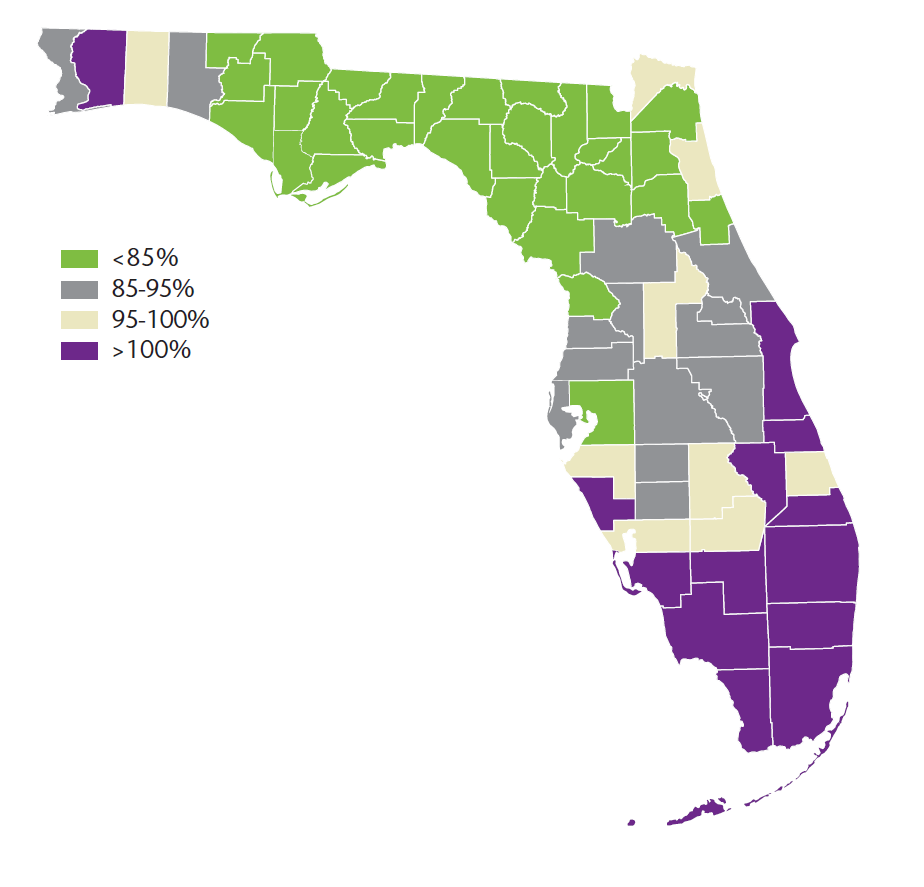
Key Findings:
- Variable expenses, including commissions and premium taxes, run 18 points of written premium.
- The book models to a combined ratio of 100, with 13 individual counties showing CRs above 100.
- Florida specialists show high double-digit modeled ROEs with 61 of 67 counties, including Miami-Dade, showing positive ROEs in catastrophe-free years.
- In catastrophe years, including severe hurricanes but within the insurers’ reinsurance coverage (FHCF and private treaties), we model 54 counties with non-negative ROEs.*
- Assignment of benefits’ results are available by region. Palm-Beach, for example, receives the same assignment of benefits affected loss ratio in our study as Miami-Dade. This likely distorts results from actual.
Premium growth and rate activity for Florida specialists from 2010 to 2018
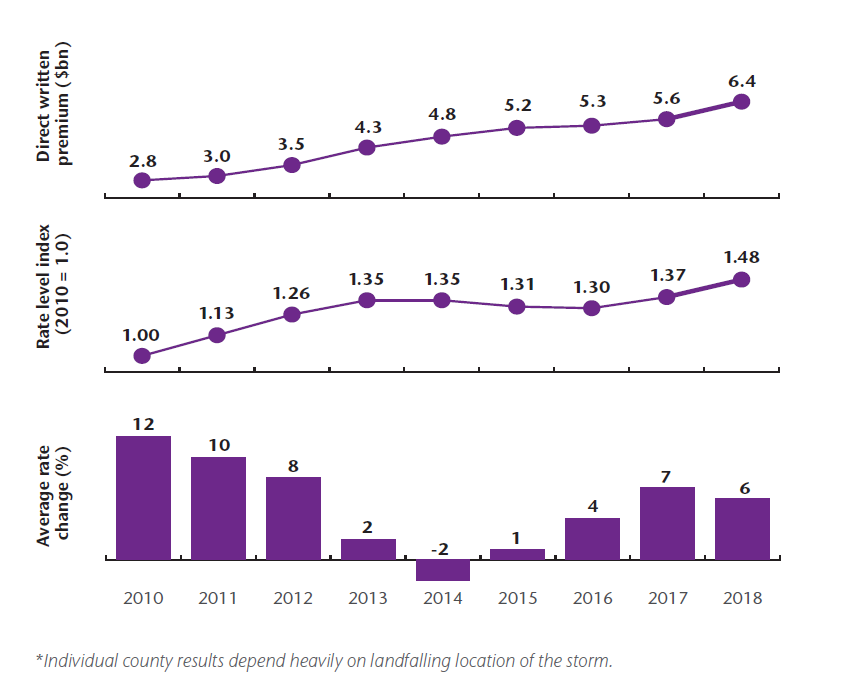
Key Findings:
- Premium volume increased substantially as Florida specialists dominated the market
- Rates showed strong positive movement in the period most heavily affected by sinkholes (2010 to 2012) and since assignment of benefits issues emerged in 2016
- Small and negative rate movements during 2013 to 2015 reflect reinsurance price decreases being passed on to policyholders
Model adjusted prospective combined ratios Florida subsidiaries
Key Findings:
- Variable expenses, including commissions and premium taxes, run 13 points of written premium.
- The book models to a combined ratio of 85, with 62 of 67 counties showing CRs below 100.
- Florida subsidiaries show modest single-digit all-in ROEs, with 55 counties showing positive prospective ROEs. This reflects a risk tolerance that amounts to single-digit market share in the most cat exposed southern and eastern coast counties.
- While they achieve positive ROEs on average, this group models to a negative 23 ROE in years with a catastrophe reflecting their higher net catastrophe retentions.
Premium growth and rate activity for Florida subsidiaries from 2010 to 2018
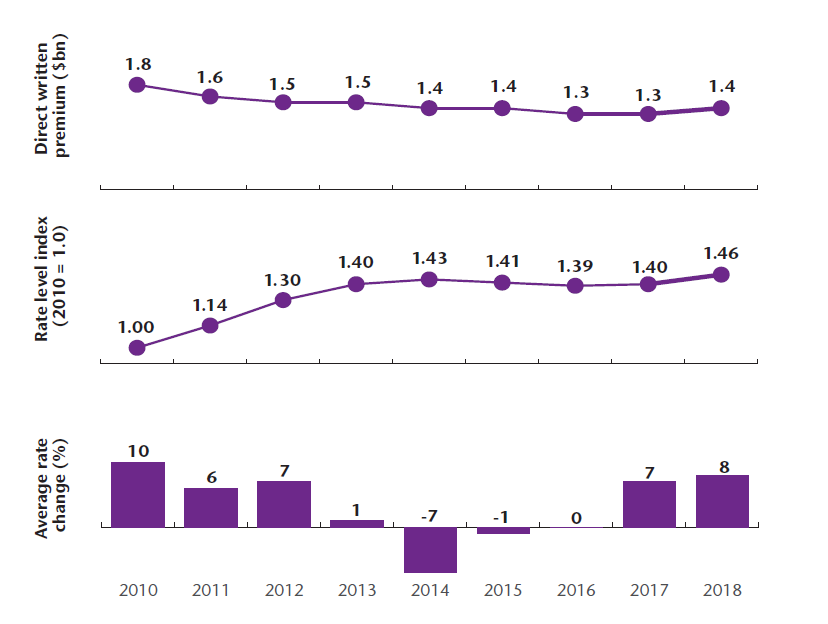
Key Findings:
- Premium volume decreased as national insurers retracted after the 2004 and 2005 storm seasons.
- Rates showed strong positive movement in the period most heavily affected by sinkholes (2010 to 2012) and renewed movement in 2017
- Small and negative rate movements during 2013 to 2016 reflect reinsurance price decreases being passed on to policyholders
Contact:
Paul Eaton
Actuarial Managing Director, Aon
link