Executive Compensation: The Winds of Change
Changing Competitive Landscape
The second important factor that is impacting executive compensation is the competitive landscape for executive talent. This landscape is fast changing with the emergence of new age businesses especially the ones catering to the large Indian middle class whose spending capacity is expected to increase in the coming years if the India growth story continues. The executive talent movement was never limited within an industry but inter-industry movement has intensified and will continue to do so as the sunrise industries like e-Commerce achieve scale.
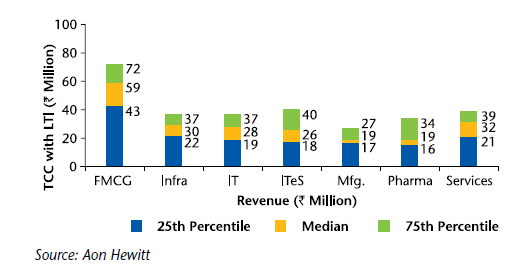
CEO Total Cost to Company with LTI (Rs. Million)
The Aon Hewitt Executive Compensation study brings upsome interesting insights on how the executives are being paid in today's environment in different industries. The analysis not only throws light on the quantum of pay for CEOs and other executives but also shows some interesting insights on how total compensation is structured.
Executive Compensation Levels
The survey data represents a period when India was on the verge of a change in government and in our view, the compensation data for the top/senior management shows cautious optimism with respect to the overall growth of the economy. Fixed compensation for CEOs based on same company analysis has moved in a range of 5.5% to 12.0% with a median of 9%. For the other CXO level population, the fixed pay has moved in the range of 5.7% to 12.2% with a median of 9.2%. Compensation levels for CEOs (refer Chart 1) show a very wide variance in compensation in companies between a revenue range of `50-100 billion. The compensation level at 75th percentile in this revenue bracket is more than four times the 25th percentile. The overall correlation of executive compensation with key fundamentals like revenue size remains low in India compared to western economies1. For companies that offer long-term incentives, approximately half of the total compensation is not guaranteed i.e. it is either delivered through annual variable pay or long-term incentives. For these companies, annual variable pay is approximately 40% of fixed pay and longterm incentives are approximately 50% of fixed pay. The CEO compensation on an average is 2.33 times the compensation of other CXOs2 (refer Table 2).
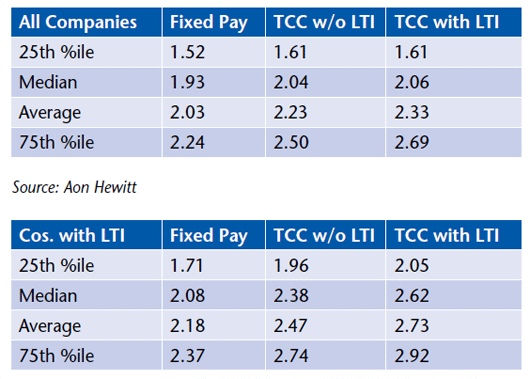
If we analyze the ratio of CEO compensation with other CXOs in companies that offer long-term incentives, we see that there is not much difference in fixed pay ratio (1.93 in all companies and 2.08 in companies with LTI at median levels), however, the ratio is much higher on TCC with LTI (2.06 in all companies and 2.62 in companies with LTI at median levels). It is evident that companies offering LTI create a considerable difference through higher long-term incentive grants to the CEO.The ratio of CEO compensation to other CXOs differs substantially by industry (refer Table 3). If we analyze companies that have long-term incentives, the ratio on total compensation is lowest in manufacturing sector reflecting that the difference in CEO and other CXO level compensation is lowest in this sector. The differential in CEO and CXO level pay is highest in the IT sector mainly on account of larger long-term incentive grants. In our view, these ratios are fairly low compared to differentials we see between the CEO and next level CXOs in western economies.
|