Executive Compensation: The Winds of Change
Industry-wise Ratio of CEO Pay to Key CXOs

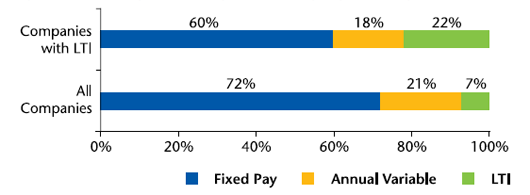
Compensation structure for CXOs (refer Chart 2) shows that approximately 40% of total pay is not guaranteed and is in the form of annual incentives or long-term incentives (considering only those companies that offer long-term incentives). Annual variable pay as a percentage of fixed compensation is approximately 30% and longterm incentives are approximately 37% of fixed pay.
CXO Pay Mix
Wealth Creation
The third important factor is change in compensation packages that provide executives an opportunity to create wealth. Stock option programs have been used traditionally to provide this opportunity and continue to do so. However, the stock based long-term incentive component for executives should be viewed in the right context i.e. in compensation surveys, the long-term incentive values are captured as on the date of grant using fair value methodology (e.g. worth of stock options on the grant date using models like Black-Scholes, Binomial, etc.). It is important to note that this fair value does notnecessarily show the wealth creation opportunity of the grant. In most models, the starting point is share price on grant date and fair value in all cases is less than or equal to share price on grant date (depending on number of factors, fair value of "at the money" stock options typically vary from 30% to 50% of share price and fair value of full value instruments i.e. options issued at par value of share vary between 90-100% of share price on grant date). So, while the survey data may show a lower long-term incentive component for some industries (e.g. other services which include e-Commerce), the actual realized wealth or realizable wealth could be multiple times of fair value. This is especially true for new age businesses like e-Commerce where valuations have increased multifold in a very short span of time creating wealth both for shareholders and executives. What is becoming increasingly important is the pace of wealth creation. On one side of the spectrum we have traditional manufacturing businesses that are facing tough times with overall global economy being slow and on other side are new age businesses like e-Commerce where valuations are multiplying in matter of months. Option holders in companies on these two sides of the spectrum see a very different wealth creation opportunity. This is the area where the Compensation Committees and the Boards need to be cautious and ensure that long-term health of an organization is by no means compromised to increase the pace of wealth creation. Sustainability of performance is the key in the longterm health of a company and the structure of stock programs should aim at providing the same. Our academic analysis of stock option programs, to an extent, proves that albeit a slower pace, option programs have created wealth for executives in most sectors over the long run and the wealth realized by executives is multiple times the fair value determined on the date of grant.
Realized vs. Fair Value Debate
We analyzed data from 43 listed organizations that form part of Sensex and Nifty excluding the Public Sector Enterprises. Assuming that these companies made an "at the money" stock option grant in April 2010, most common practices of vesting and exercise periods, these options would have had an "expected exercise" period of 4.5 years i.e. options will be exercised in October 2014. 25% of these companies' options would have been underwater as of October 2014 (share price in October less than the exercise price i.e. share price on grant date).
|