.png?width=888&height=337&ext=.png)
Demographic Horizons™
Base Mortality Framework
Aon have invested heavily in our Demographic Horizons baseline mortality analytical processes and tools. Our modelling framework is tried and tested - we use it for all our advice in total over 1,200 cases internationally. Our framework is used:
- to advise insurers and reinsurers
- to advise pension plans and companies, and
- for all our Aon Scheme Actuary pension plan funding advice.
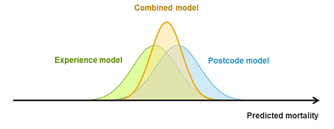
Our baseline mortality assessment has two components:
- a postcode model – the UK model is calibrated to our proprietary central bank of mortality data for 200+ defined benefit pension schemes
- an experience model – calibrated to the mortality data for the actual scheme in question (where this has been provided)
The combined best estimate model is a weighted average of these two components, where the weight reflects relative statistical confidence in each model's predictions:
- we measure the confidence in the postcode model by testing its actual performance in predicting mortality for pension schemes outside the calibration dataset, and
- we measure the confidence in the experience model based on the statistical uncertainty in the scheme mortality data to which it is fitted.
This approach is robust and objective.
It provides a concrete means of combining the two sources of information in one consistent framework, correctly accounting for their relative uncertainty.
Postcode Model
To reflect the range of mortality characteristics of individuals within a pension scheme, our postcode model assigns each individual their own mortality curve based on their:
- Gender
- Member group (active, deferred, retiree, dependant)
- Socio-economic type
- Geographic location
The key predictive rating factor in our postcode model is socio-economic type. This is determined from an individual’s residential postcode using third-party consumer classifications.
For instance, there are 1.7 million residential postcodes in the UK – one for every 15 households on average. This provides a very high-resolution mapping for mortality calibration. Two households in adjacent streets may be mapped to quite different socio-economic types, depending on their characteristics.
Our UK postcode model is calibrated to the combined mortality data of over 200 defined benefit pension plans, with wide coverage across socio-economic types, industries and geographic regions.
Using ‘leave-one-out cross-validation’, we test that our calibration of the postcode model works in practice, i.e. that it actually predicts pension scheme mortality as accurately as possible.

The average discrepancy in this test across all pension schemes in the databank gives a fair, objective measure of the model’s actual predictive power for new schemes outside the calibration dataset. Cross-validation is critical because it:
- tests the model’s purpose, i.e. prediction of mortality at pension plan level – in contrast, in-sample tests are notorious for overstating predictive power, and
- allows us to compare the performance of alternative models (e.g. models based on different rating factors) – cross validation is how we select our model.
Finally, cross-validation also provides an objective measure of how predictive the model is. This means that we can place a confidence interval around the mortality rates produced by the model, which
- is useful for assessing the uncertainty of the results, and
- enables the user to combine the postcode model with the plan-specific mortality experience e.g. by weighting the results using statistical credibility.
Our postcode analysis produces a robust best-estimate mortality basis, with a transparent measure of uncertainty based on leave-one-out cross-validation.
Experience Model
For cases with sufficient mortality experience, a robust estimate of base mortality can be produced, alongside an appropriate measure of uncertainty.
We can model mortality experience for a portfolio relative to a standard mortality table or the postcode model – we default to the latter because this automatically captures heterogeneity, without the need for credible evidence of heterogeneity in the experience data itself (which requires very large datasets). In a mortality context, persistent heterogeneity is known as ‘frailty’ and tends to increase present values (because, as the liabilities are run off, the average mortality becomes lighter).
This matters because not capturing frailty makes you more likely to under-estimate liabilities. At Aon, we regard the above approach as a key safeguard, especially where experience data is credible but the dataset is not large enough to fully capture heterogeneity.
Our UK postcode model incorporates variation in mortality rates between years and seasonal variation within years, including the exceptionally high rates of mortality during the COVID-19 pandemic. This means that we’re able to include the mortality experience from 2020 and 2021 when carrying out experience analyses using the UK postcode model.
For more information on the Demographic Horizons base mortality model, please contact Matt Fletcher, Miles Blackford or any member of the Demographic Horizons team.