
Demographic Horizons™ Blog
Matt Fletcher FIA

Matt is Aon’s expert on drivers of mortality change, including international mortality trends and causes of death.
CMI_2019 ‐ a preview
In March 2020, the Continuous Mortality Investigation (CMI) will publish an updated version of their mortality projections model, CMI_2019, incorporating deaths in the England & Wales population up to the end of 2019.
Aon’s Demographic Horizons™ team have analysed the likely implications of the new data for the model. Our expectations are:
- Adding 2019 data to the CMI’s mortality projections model will increase projected life expectancies slightly – we expect the overall impact on liabilities to be an increase of less than 0.5%
- The sensitivity of the model to changes in the two “Extended” parameters will be different to previous versions of the model
- Changing the “initial addition” (A) parameter will have roughly the same impact as before
- Changing the “period smoothing” (Sκ) parameter will have a different impact to before; actuaries adjusting Sκ to set a valuation basis may need to reconsider whether retaining the same level of adjustment is still appropriate
- For females, using either a lower or higher value of Sκ will lead to higher liabilities than using the Core model
Impact of new data
The Office for National Statistics (ONS) have published weekly deaths data up to the end of 2019. The CMI’s Mortality Monitor report shows that 2019 has seen the strongest full-year mortality improvement since 2009, at 3.6%.
Using the deaths and population data published by the Office for National Statistics, it is already possible to produce an advance estimate of the impact the new mortality data is likely to have on life expectancies and liabilities.
Our estimates suggest that projected male life expectancies from age 65 in 2020 will increase by around 4 weeks (0.3%) and female life expectancies by around 7 weeks (0.5%). This will be the first increase in projected life expectancy since 2014, when CMI_2014 was issued.
Extended parameters
The CMI model is calibrated based on mortality data for the England & Wales population, whereas its outputs are typically used to estimate mortality improvements for other populations, for example a specific pension scheme or annuity portfolio. The CMI have made it clear that users of the model should
“consider whether [the model’s] parameters should be modified for other populations, such as pension scheme members who have experienced higher mortality improvements in the recent past”
To help users to achieve this without having to modify the model extensively, the “Extended parameters” were introduced – firstly in CMI_2016 the period smoothing (Sκ) parameter, followed in CMI_2018 by the initial addition (A) parameter.
Initial addition (A)
Increasing the A parameter adds a flat* adjustment to the initial age-period rates of improvement produced by the model. The sensitivity of liabilities to the same change in A parameter does not change significantly, regardless of which version of the CMI model is used. The chart below shows the impact of using an A parameter of 0.5% p.a. compared to the Core model for men and women, with lighter bars representing CMI_2018 and darker bars CMI_2019.
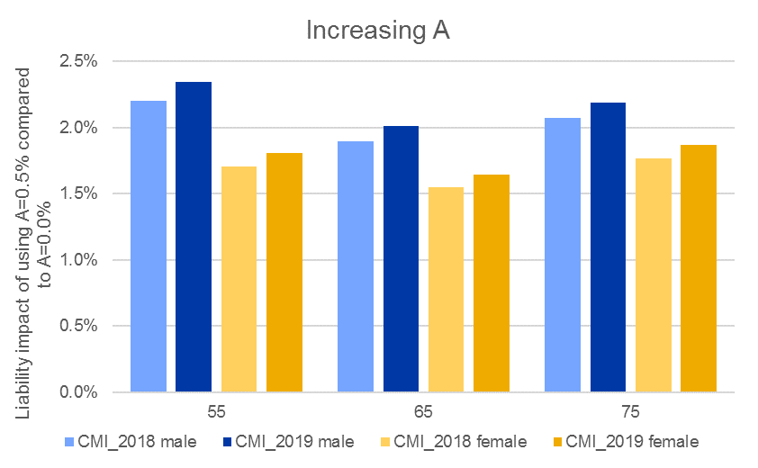
Whilst there is some age structure to the impact, and the A parameter increases male liabilities more than female, it is clear from the chart that using the same 0.5% p.a. A parameter with CMI_2019 has only a marginally higher liability impact (around 0.1%) than with CMI_2018.
*up to age 85, tapering linearly to nil at age 110
Period Smoothing (Sκ)
The CMI model contains several smoothing parameters – changing their values changes the smoothness of the model fit. Increasing the period smoothing parameter (Sκ) has the effect of putting less weight on the latest observed mortality improvement – because these have been low in previous years, increasing Sκ from its Core value has increased the initial improvement rates and increased liabilities.
However, because 2019 saw a strong mortality improvement, increasing Sκ in the 2019 model means that less weight is placed on both the low rates from previous years, and the high rate in the final year. So the impact on the model of increasing Sκ from its Core value will be much smaller in CMI_2019 than it has been in previous versions of the model. This is illustrated in the chart below, which shows the impact of using Sκ of 7.5 compared to the Core value of 7.0, on both the CMI_2018 and CMI_2019 models.
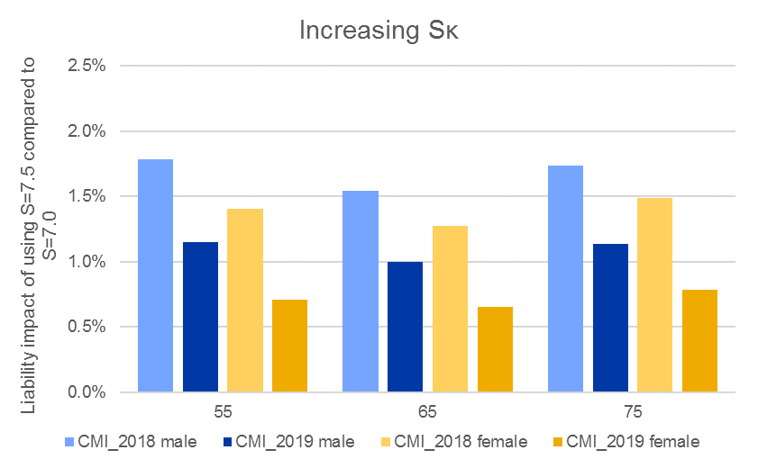
This means that, if a user of the model has been using Sκ to adjust the initial rates of improvement, they will need to consider whether this approach remains appropriate, and at a minimum re-visit the adjustment made to Sκ to ensure it remains appropriate when using CMI_2019. The CMI specifically addressed this point in Working Paper 119 which accompanied the release of CMI_2018, but this is the first time that the difference has become obvious in practice.
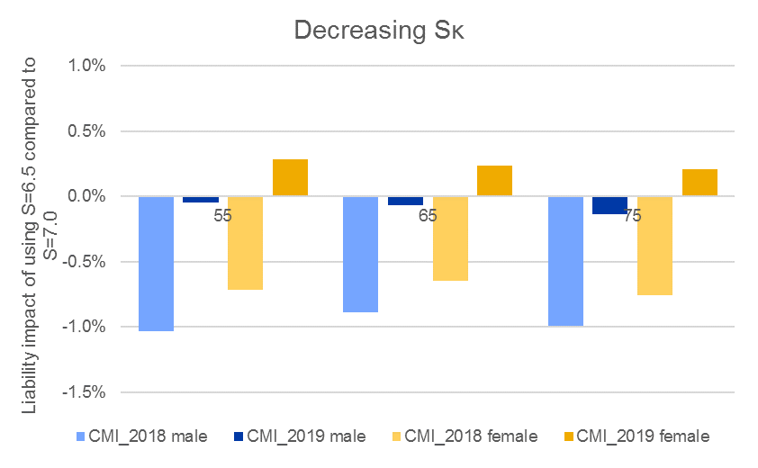
A further point to note is that we expect that, for females, increasing and decreasing the value of Sκ are both likely to lead to higher liabilities than using its Core value. Again, this is because using a lower value of Sκ has the effect of putting more weight on the most recent improvements (which in 2019 were relatively high). This has not been the case for previous versions of the model, and casts doubt on the use of a given level of Sκ to introduce prudence into mortality projections.
The chart below shows the change in the effect of decreasing the value of Sκ for males and females, using CMI_2018 and our estimate of CMI_2019.
If you would like more information about the CMI model, mortality improvements, or any aspect of mortality or other demographic modelling, please get in touch with Matt Fletcher or any member of the Demographic Horizons team.
Note: the author is chair of the Continuous Mortality Investigation (CMI) Self Administered Pension Scheme (SAPS) committee and is also a member of the CMI’s Executive Committee. Any views expressed in this post are in the author’s capacity as an employee of Aon, not on behalf of CMI.
All calculations backing this post are by Aon, based on the CMI’s published approach and data provided by the Office for National Statistics.