Article
Featuring information on 30 million employees working in 100-plus countries at over 8,500 participating organizations, the Radford McLagan Compensation Database is one of the world's leading sources of compensation data and insights for total rewards professionals.
This data, delivered on Aon's powerful Human Capital Analytics platform, allows clients to benchmark pay for thousands of unique jobs across demographic, geographic and industry lines, and also engage in complex modeling exercises to address today's most challenging workforce issues.
To learn more about the core reporting tools you'll gain access to by agreeing to participate in and purchase the Radford McLagan Compensation Database, continue exploring below:
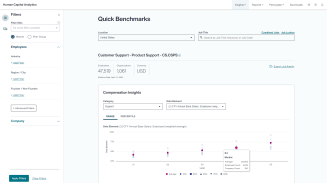
In a bind? Looking for data fast? Our Quick Benchmarks feature allows clients to instantly explore compensation data for thousands of jobs in any market using advanced filtering. Information is dynamically rendered on screen and available to export in seconds.
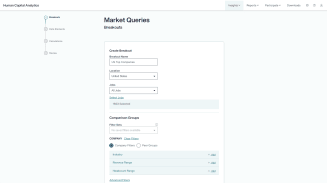
Are you on the hook to do the heavy lifting for your company’s next annual focal period? Market Queries allows you to create, save, download and reuse comprehensive benchmarking reports across all of your applicable talent markets in minutes.
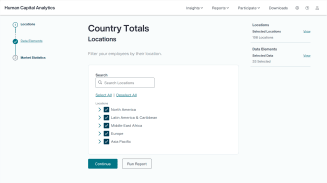
Sometimes, especially in smaller countries, highly-targeted queries don't produce the results you're looking for. In these cases, leveraging Country Totals means that in a matter of a few clicks, you can instantly download overall results for one or more countries. You can also use custom data element sets to zero-in on data that matters most to you.
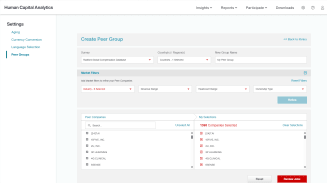
Create, save and reuse your own custom peer groups from a database of 8,500-plus participating organizations and run results via customized queries that you can design. Select companies by name or tens of demographic factors.
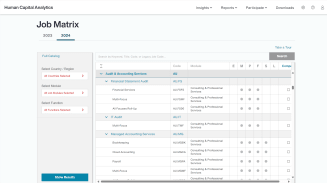
Accurate job matching is essential to any compensation benchmarking effort. Use our Job Matrix to search and navigate Aon's complete job library in seconds, read job descriptions, and see where your organization has active employee matches.
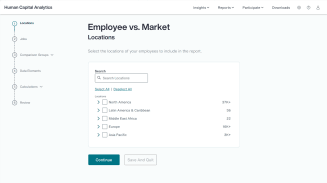
Select an employee population, select a market, and compare them in real time. It’s that easy. Then use our tools to identify outliers so you can quickly focus on remediating employee retention risks.
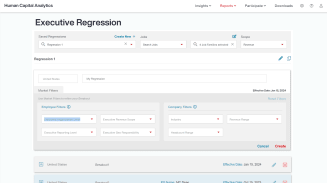
Finding data on executive pay that is perfectly right-sized to your organization can be a challenge. Our Executive Regression feature allows you to estimate executive pay levels specific to the size of your organization using statistically valid methodologies.
