Report

De-risking AI, IP, and Cyber
2024 Intangible Versus Tangible Risks Comparison Report
Sponsored by Aon. Independently conducted by the Ponemon Institute. Published May 2024.
The 2024 Intangible versus Tangible Risks Comparison Report is based on insights from 2,462 small, medium and large organizations across a broad range of industries throughout the world.
Potential losses related to intangible asset values from evolving perils such as generative artificial intelligence (AI), cyber security, and intellectual property (IP) misappropriation are already significant. As we journey through a highly complex multi-decade AI transformation – where the upside rewards and downside perils are uncertain – the velocity of these risks is set to increase.
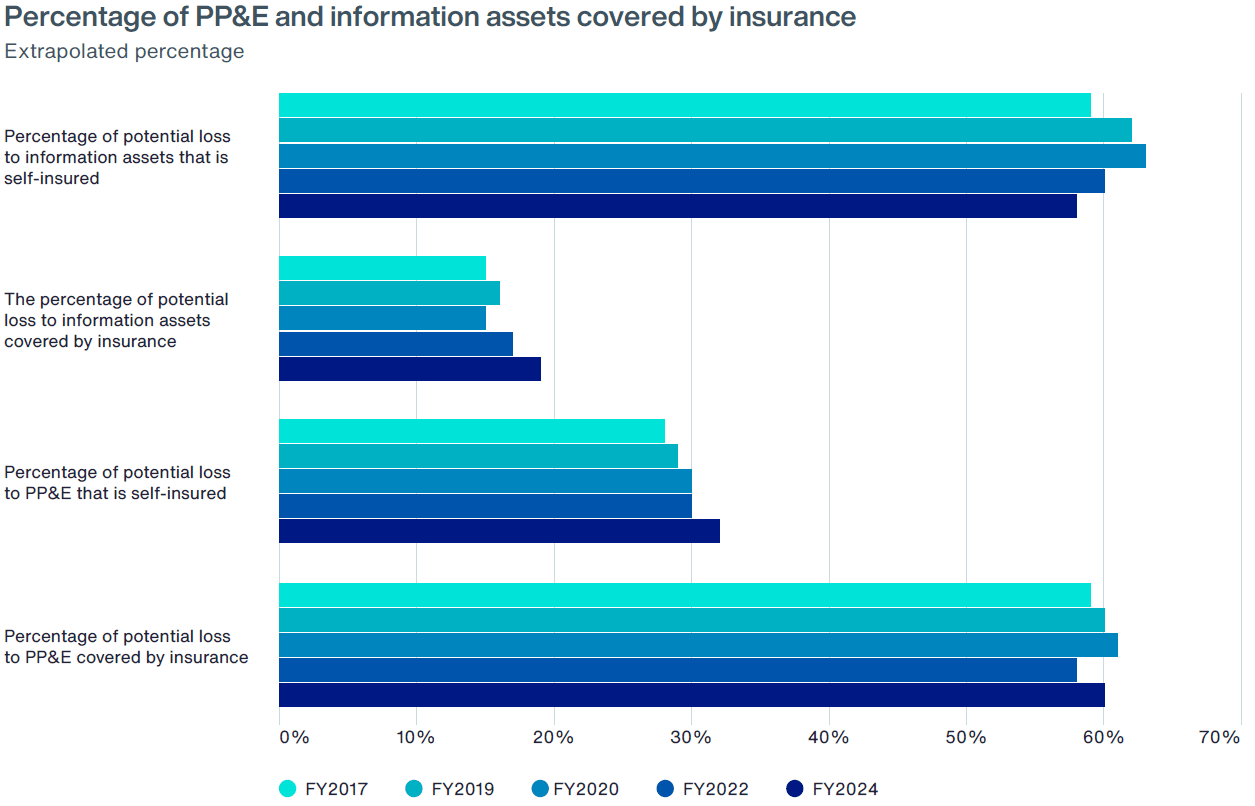
Despite this, a significant protection gap persists for intangible assets, with only 19 percent insured according to our research. Tangible assets, despite their lower relative value, are insured to a level three times greater, at 60 percent.
44%
Only 44 percent of respondents said they are prepared for a cyber or IP ‘Black Swan’ event.
The industry traditionally reflects history as a way to predict the future. It’s not enough in the context of cyber or generative AI. At any point in time, there are these shocks... but over time, can we understand and model this risk? Yes.
What is the report about?
This research aims to provide a better understanding of the evolving threats of generative AI, cyber and IP. It highlights the role insurance can play in protecting intangible assets to help organizations make better decisions regarding allocation of their finite resources to protect against tangible and intangible perils.
In the report, we compare the relative:
- Value of certain tangible (Property, Plant & Equipment) compared to certain intangible assets (Information assets and IP)
- Quantification of potential losses from tangible compared to intangible assets
- Insurance protection of tangible compared to intangible assets

Report
2024 Intangible versus Tangible Risks Comparison Report
Key findings from the report show:
-
The likelihood of a loss is higher for intangible assets than for tangible assets.
-
The average total value of intangible assets is nearly 14% higher than that of tangible assets.
-
The average Probable Maximum Loss for intangible assets is almost 37% higher than that of tangible assets.
-
67% of organizations use or intend to use AI products or services.
-
56% of organizations had a material or significantly disruptive security exploit or data breach one or more times in the past 24 months.
-
While most organizations do not have specific IP insurance policies, nearly two-thirds of organizations say they have an interest in purchasing them.
About this research
The consolidated sampling frame is composed of 63,112 individuals located in North America, Europe, the Middle East, Africa, Asia Pacific, Japan and Latin America. Respondents are involved in their company’s cyber risk management as well as enterprise risk management activities. 2,790 respondents completed the survey, of which 327 were rejected for reliability issues. The final sample consisted of 2,462 surveys.

Aon's Better Being Podcast
Our Better Being podcast series, hosted by Aon Chief Wellbeing Officer Rachel Fellowes, explores wellbeing strategies and resilience. This season we cover human sustainability, kindness in the workplace, how to measure wellbeing, managing grief and more.
-

Podcast 23 mins
Better Being Series: Understanding Burnout in the Workplace -
Podcast 14 mins
Better Being Series: Why Nutrition Matters -
Podcast 10 mins
Better Being Series: Discover the ‘Blue Zones’ Where People Live Longer -
Podcast 20 mins
Better Being Series: Improving Your Financial Wellbeing -
Podcast 17 mins
Better Being Series: Are You Taking Care of Your Digital Wellbeing? -
Podcast 19 mins
On Aon Podcast: Better Being Series Dives into Women’s Health -
Podcast 25 mins
On Aon’s Better Being Series: Managing Loss and Grief

Aon Insights Series Asia
Expert Views on Today's Risk Capital and Human Capital Issues
-

Article 8 mins
Thriving in an Interconnected World: How the C-Suite Embraces Uncertainty -

Article 6 mins
Powering Progress: Collaborating to Build a Sustainable Future in Emerging Markets -

Article 5 mins
Building Business Resilience: Key Steps to Effectively Integrate Risk Management Across Your Organisation -

Article 7 mins
Why Humans Are the Essential Factor in the Success of Artificial Intelligence (AI) -

Article 5 mins
Leveraging Research and Expertise to Strengthen Your HR Strategy for 2025 and Beyond -

Article 5 mins
Managing Risk on the Energy Transition Journey -

Article 7 mins
The Role of Risk Management in the Age of Generative Artificial Intelligence -

Article 7 mins
Finding A Way In Asia Pacific's New Economic Reality -

Article 4 mins
Three Ways to Boost Value from Benefits: APAC Insights from LinkedIn


Aon Insights Series Pacific
Expert Views on Today's Risk Capital and Human Capital Issues
-

Article 3 mins
Article Template to Duplicate

Aon Insights Series UK
Expert Views on Today's Risk Capital and Human Capital Issues
-

Article 2 mins
Introduction: Clarity and Confidence to Act Now -

Article 11 mins
Navigating a New Age of Macroeconomic Uncertainty -

Article 3 mins
Making Better Decisions — A C-Suite Perspective -

Article 3 mins
Understanding the Dynamics of Today’s Workforce — Reward, Retain, Evolve -

Article 3 mins
Artificial Intelligence — Managing the Risk and Potential -

Article 10 mins
Unlocking Balance Sheet Value to Empower Your Business Strategy -

Article 3 mins
Navigating the Unpredictable: Aon’s Suite of Actionable Analytics -

Article 4 mins
Redefining Risk Capital as a Business Enabler: Veolia's Innovative Approach -

Article 9 mins
A Data-Driven Approach to Better Workforce Decisions -

Article 5 mins
The Importance of Pay Transparency -

Article 6 mins
How Human Capital Data Enhances Risk Management for Financial Institutions -

Article 4 mins
The Battle for Top Talent in the Professional Services Sector -

Article 5 mins
Insights on a Volatile World — Risk Factors That Businesses Need to be Monitoring


Client Trends 2025
Better Decisions Across Interconnected Risk and People Issues.
-

Article 3 mins
Acknowledging Our Complex Reality -

Article 10 mins
Trade in a Technology-Driven Future -

Article 9 mins
How AI and Workforce will Intersect: Navigating Risks and Opportunities -

Article 8 mins
Weather and Workforce: Employers Must Quantify the Risk -

Article 9 mins
Steering Trade and Supply Chains Amid Weather Challenges -

Report 13 mins
Trade Issues Confront Global Businesses on Multiple Fronts -

Report 19 mins
Technology is Driving Firms to Harness Opportunities and Defend Against Threats -

Report 19 mins
Climate Analytics Unlock Capital to Protect People and Property -

Report 14 mins
A Workforce in Transition Prepares to Meet a Host of Challenges


Construction and Infrastructure
The construction industry is under pressure from interconnected risks and notable macroeconomic developments. Learn how your organization can benefit from construction insurance and risk management.
-

Article 8 mins
How North American Construction Contractors Can Mitigate Emerging Risks -

Article 7 mins
Managing Construction Risks: 7 Risk Advisory Steps -
Article 7 mins
Unlocking Capacity and Capital in a Challenging Construction Risk Market -

Article 7 mins
Protecting North American Contractors from Extreme Heat Risks with Parametric -
Article 5 mins
How Climate Modeling Can Mitigate Risks and Improve Resilience in the Construction Industry -

Report 1 mins
Construction Risk Management Europe Report 2023 -

Article 8 mins
Parametric Can Help Mitigate Extreme Heat Risks for Contractors in EMEA


Cyber Resilience
Our Cyber Resilience collection gives you access to Aon’s latest insights on the evolving landscape of cyber threats and risk mitigation measures. Reach out to our experts to discuss how to make the right decisions to strengthen your organization’s cyber resilience.
-

Article 8 mins
Cyber and E&O Market Conditions Remain Favorable Amid Emerging Global Risks -

Article 7 mins
How to Navigate AI-Driven Cyber Risks -

Article 9 mins
Building Resilience in a Buyer-Friendly Cyber and E&O Market -

Article 11 mins
A Middle Market Roadmap for Cyber Resilience -

Article 7 mins
Lessons Learned from the CrowdStrike Outage: 5 Strategies to Build Cyber Resilience -

Article 8 mins
Responding to Cyber Attacks: How Directors and Officers and Cyber Policies Differ -

Article 6 mins
Why Now is the Right Time to Customize Cyber and E&O Contracts


Employee Wellbeing
Our Employee Wellbeing collection gives you access to the latest insights from Aon's human capital team. You can also reach out to the team at any time for assistance with your employee wellbeing needs.
-

Article 8 mins
Employer Strategies for Cancer Prevention and Treatment -

Article 6 mins
The Long-Term Care Conundrum in the United States -

Article 9 mins
Developing a Paid Leave Strategy That Supports Workers and Their Families -

Article 9 mins
4 Ways to Foster a Thriving Workforce Amid Rising Health Costs -

Article 9 mins
The Next Evolution of Wellbeing is About Performance -

Article 6 mins
Three Ways Collective Retirement Plans Support HR Priorities -

Article 9 mins
How the Right Employee Wellbeing Strategy Impacts Microstress and Burnout at Work -
Podcast 13 mins
On Aon Podcast: The Future of Healthcare: Key Factors Impacting Medical Trend Rates -

Article 7 mins
Making Wellbeing Part of a Company’s DNA -

Article 7 mins
A Comprehensive Approach to Financial Wellbeing


Environmental, Social and Governance Insights
Explore Aon's latest environmental social and governance (ESG) insights.
Q4 2023 Global Insurance Market Insights
Our Global Insurance Market Insights highlight insurance market trends across pricing, capacity, underwriting, limits, deductibles and coverages.
-

Article 12 mins
Q4 2023: Global Insurance Market Overview -

Article 13 mins
Top Risk Trends to Watch in 2024


Global Risk Management Survey
Better Decisions Across Interconnected Risk and People Issues.
-

Report 28 mins
A New Era of Converging Risks and Accelerating Disruption -

Article 1 mins
Top 10 Global Risks -

Article 1 mins
Industry Insights: Findings from Aon's Global Risk Management Survey -

Article 1 mins
Regional Results -

Article 41 mins
Country-Level Findings -

Report 5 mins
Methodology and Respondent Demographics


Regional Results
How do the top risks on business leaders’ minds differ by region and how can these risks be mitigated? Explore the regional results to learn more.
-

Article 12 mins
Rethinking Resilience: Addressing Asia Pacific’s Top Risks -

Article 10 mins
Turning Uncertainty into Opportunity: Managing Risk in the EMEA Region -

Article 10 mins
Latin America’s Risk Landscape: Turning Complexity into Competitive Advantage -

Article 10 mins
Rethinking Resilience: Navigating North America’s Evolving Risk Landscape


Impact Report 2025
Explore Aon's corporate sustainability impact and strategy.
-

Article 7 mins
Executive Summary -

Article 13 mins
Aon’s Environmental Sustainability -

Article 15 mins
Supporting Energy Resilience and a Transition to a Low-Carbon Economy -

Article 20 mins
Our Commitment to Our Colleagues -

Article 8 mins
Our Community Impact -

Article 10 mins
Governance -

Article 8 mins
Cyber and Data Security -

Article 11 mins
Redefining Resilience


Top 10 Global Risks
Trade, technology, weather and workforce stability are the central forces in today’s risk landscape.
-

Article 6 mins
Cyber Risk: Turning Uncertainty into Opportunity -

Article 7 mins
Business Interruption: Managing Risk in an Interconnected World -

Article 6 mins
Why Economic Slowdown is an Ongoing Risk for Organizations -

Article 8 mins
Navigating Regulatory and Legislative Change -

Article 5 mins
Increasing Competition Is Intensifying Risk for Organizations -

Article 7 mins
Commodity Price Risk and Material Scarcity: An Escalating and Complex Risk -

Article 9 mins
Supply Chain or Distribution Failure: Navigating the New Normal -

Article 5 mins
Damage to Reputation or Brand: A Critical Risk -

Article 6 mins
Geopolitical Volatility: Preparing for the Unpredictable -

Article 6 mins
Cash Flow and Liquidity Risk: A Rising Challenge


Industry Insights
These industry-specific articles explore the top risks, their underlying drivers and the actions leaders are taking to build resilience.
-

Article 9 mins
Building Resilience to Support Growth in Construction and Real Estate -

Article 10 mins
Managing Risk and Unlocking Opportunity in the Food, Agribusiness and Beverage Industry -

Article 8 mins
Adapting to Disruption: How Financial Institutions are Reframing Risk -

Article 10 mins
Turning Risk into Resilience in the Industrials and Manufacturing Industry -

Article 11 mins
Navigating Risk in Insurance: Turning Complexity into Competitive Advantage -

Article 10 mins
Navigating Risk in Life Sciences: Building Resilience to Support Growth -

Article 11 mins
Navigating Volatility in Natural Resources: Risk Management as a Value Driver -

Article 10 mins
Navigating Risk in Transportation and Logistics: Gearing Up for Big Transitions -

Article 9 mins
Technology, Media and Communications: Rethinking Risk in a Shifting Landscape


Human Capital Analytics
Our Human Capital Analytics collection gives you access to the latest insights from Aon's human capital team. Contact us to learn how Aon’s analytics capabilities helps organizations make better workforce decisions.
-

Article 35 mins
5 Human Resources Trends to Watch in 2025 -
Article 13 mins
Medical Rate Trends and Mitigation Strategies Across the Globe -

Article 9 mins
3 Strategies to Help Avoid Workers Compensation Claims Litigation -
Podcast 15 mins
On Aon Podcast: Using Data and Analytics to Improve Health Outcomes -

Article 14 mins
How Technology Will Transform Employee Benefits in the Next Five Years -
Podcast 18 mins
On Aon Podcast: Technology Impacting the Future of Health and Benefits -

Article 11 mins
Designing Tomorrow: Personalizing EVP, Benefits and Total Rewards


Human Capital Quarterly Insights Briefs
Read our collection of human capital articles that explore in depth hot topics for HR and risk professionals, including using data and analytics to measure total rewards programs, how HR and finance can better partner and the impact AI will have on the workforce.
-

Article 12 mins
Total Rewards Strategies That Drive Business Outcomes -
Article 35 mins
5 Human Resources Trends to Watch in 2025 -

Article 20 mins
5 Ways HR Can Partner with Finance to Drive Growth -

Article 15 mins
How Artificial Intelligence is Transforming Human Resources and the Workforce -

Article 15 mins
Five Big Human Resources Trends to Watch in 2024 -
Article 11 mins
Designing Tomorrow: Personalizing EVP, Benefits and Total Rewards -

Article 10 mins
How Data and Analytics Can Optimize HR Programs -

Article 15 mins
Get Ready for the Top 5 HR Trends in 2023


Insights for HR
Explore our hand-picked insights for human resources professionals.
-

Article 7 mins
COVID-19 has Permanently Changed the Way We Think About Wellbeing -
Article 10 mins
How Data and Analytics Can Optimize HR Programs -

Article 7 mins
Case Study: The LPGA Unlocks Talent Potential with Data -

Article 10 mins
Navigating the New EU Directive on Pay Transparency -

Article 7 mins
Rethinking Your Total Rewards Programs During Mergers and Acquisitions


Workforce
Our Workforce Collection provides access to the latest insights from Aon’s Human Capital team on topics ranging from health and benefits, retirement and talent practices. You can reach out to our team at any time to learn how we can help address emerging workforce challenges.
-
Article 8 mins
Weather and Workforce: Employers Must Quantify the Risk -
Article 12 mins
Total Rewards Strategies That Drive Business Outcomes -

Article 8 mins
AI and Workforce Skills: Who Should Act and Why Now? -

Article 19 mins
3 Strategies to Promote an Inclusive Environment and Bridge the Gender Gap -
Article 8 mins
2025 Salary Increase Planning Tips -
Article 12 mins
People Risks Are Rising: Here’s How U.S. Benefits Are Stepping Up -
Article 8 mins
Employer Strategies for Cancer Prevention and Treatment -

Article 6 mins
Taking a Data-Led Approach to Job Architecture to Accelerate Pay Transparency -
Podcast 12 mins
Better Being Series: Building Sustainable Performance in a Multi-Generational Workforce -

Article 7 mins
Key Trends in U.S. Benefits for 2025 and Beyond -

Article 7 mins
Why Pay Transparency Demands a Total Rewards Lens -
Article 9 mins
4 Ways to Foster a Thriving Workforce Amid Rising Health Costs


Mergers and Acquisitions
Our Mergers and Acquisitions (M&A) collection gives you access to the latest insights from Aon's thought leaders to help dealmakers make better decisions. Explore our latest insights and reach out to the team at any time for assistance with transaction challenges and opportunities.
-
Article 7 mins
Rethinking Your Total Rewards Programs During Mergers and Acquisitions -

Article 9 mins
Organizational Design and Talent Planning are Key to M&A Success -

Article 5 mins
Project Management for HR: The Secret Behind a Successful M&A Deal -

Article 8 mins
Cultural Alignment Planning Drives M&A Success -

Report 1 mins
A Guide to Maximizing Value in Post-Merger Integrations -

Report 2 mins
The ABC's of Private Equity M&A: Deal Flow Impacts of Al, Big Tech and Climate Change -
Article 11 mins
The Silver Lining on M&A Deal Clouds: M&A Insurance Insights from 2023


Natural Resources and Energy Transition
The challenges in adopting renewable energy are changing with technological advancements, increasing market competition and numerous financial support mechanisms. Learn how your organization can benefit from our renewables solutions.
-

Article 4 mins
5 Steps for Successful Carbon Accounting Verification -

Article 6 mins
AI Innovations in Renewable Energy: Transforming the Sector -

Article 11 mins
Securing Human Capital in Natural Resources -

Article 6 mins
Decarbonizing Construction for a Low-Emission Future


Navigating Volatility
How do businesses navigate their way through new forms of volatility and make decisions that protect and grow their organizations?
Parametric Insurance
Our Parametric Insurance Collection provides ways your organization can benefit from this simple, straightforward and fast-paying risk transfer solution. Reach out to learn how we can help you make better decisions to manage your catastrophe exposures and near-term volatility.
-

Article 10 mins
How Public Entities and Businesses Can Use Parametric for Emergency Funding -

Article 6 mins
Parametric Insurance: A Complement to Traditional Property Coverage -

Article 8 mins
Using Parametric Insurance to Match Capital to Climate Risk -

Article 6 mins
Using Parametric Insurance to Close the Earthquake Protection Gap -
Article 5 mins
How Technology Enhancements are Boosting Parametric


Pay Transparency and Equity
Our Pay Transparency and Equity collection gives you access to the latest insights from Aon's human capital team on topics ranging from pay equity to diversity, equity and inclusion. Contact us to learn how we can help your organization address these issues.
-
Article 6 mins
Taking a Data-Led Approach to Job Architecture to Accelerate Pay Transparency -
Article 19 mins
3 Strategies to Promote an Inclusive Environment and Bridge the Gender Gap -

Report 1 mins
The 2024 North America Pay Transparency Readiness Study -

Article 10 mins
How Financial Institutions can Prepare for Pay Transparency Legislation -

Article 8 mins
Pay Transparency Can Lead to Better Equity Across Benefits -

Article 12 mins
Understanding and Preparing for the Rise in Pay Transparency -
Podcast 14 mins
On Aon Podcast: Understanding Pay Transparency Regulations -
Article 10 mins
Navigating the New EU Directive on Pay Transparency -

Article 6 mins
To Disclose Pay or Not? How Companies are Approaching the Pay Transparency Movement -
Podcast 19 mins
On Aon Podcast: Better Being Series Dives into Women’s Health -

Article 11 mins
Advancing Women’s Health and Equity Through Benefits and Support


Property Risk Management
Forecasters are predicting an extremely active 2024 Atlantic hurricane season. Take measures to build resilience to mitigate risk for hurricane-prone properties.
-
Article 8 mins
Florida Hurricanes Not Expected to Adversely Affect Property Market -

Article 10 mins
Build Resilience for an Extremely Active Atlantic Hurricane Season -

Article 4 mins
Four Steps to Develop Strong Property Risk Coverage in a Hardening Market -
Podcast 16 mins
On Aon Podcast: Navigating and Preparing for Catastrophes -
Article 6 mins
Parametric Insurance: A Complement to Traditional Property Coverage -

Article 4 mins
Navigating Climate Risk Using Multiple Models and Data Sets -

Article 5 mins
Rising Losses From Severe Convection Storms Mostly Explained by Exposure Growth -
Article 6 mins
Using Parametric Insurance to Close the Earthquake Protection Gap


Technology
Our Technology Collection provides access to the latest insights from Aon's thought leaders on navigating the evolving risks and opportunities of technology. Reach out to the team to learn how we can help you use technology to make better decisions for the future.
-
Article 9 mins
How AI and Workforce will Intersect: Navigating Risks and Opportunities -

Article 23 mins
The AI Data Center Boom: Strategies for Sustainable Growth and Risk Management -
Article 8 mins
AI and Workforce Skills: Who Should Act and Why Now? -
Article 7 mins
How Technology is Transforming Open Enrollment in the U.S. -

Article 15 mins
Navigating Cyber Risks in EMEA: Key Insights for 2025 -
Article 7 mins
How to Navigate AI-Driven Cyber Risks -
Article 15 mins
How Artificial Intelligence is Transforming Human Resources and the Workforce -
Podcast 9 mins
On Aon Podcast: How has CrowdStrike Changed the Cyber Market? -

Article 12 mins
5 Ways Artificial Intelligence can Boost Claims Management -

Article 12 mins
Navigating AI-Related Risks: A Guide for Directors and Officers -
Article 5 mins
How Technology Enhancements are Boosting Parametric -

Article 7 mins
How to Futureproof Data and Analytics Capabilities for Reinsurers


Trade
Our Trade Collection gives you access to the latest insights from Aon's thought leaders on navigating the evolving risks and opportunities for international business. Reach out to our team to understand how to make better decisions around macro trends and why they matter to businesses.
-
Article 10 mins
Trade in a Technology-Driven Future -
Podcast 9 mins
Special Edition: Global Trade and its Impact on Supply Chain -

Article 8 mins
The Evolving Threat of Cargo Theft: 5 Key Mitigation Strategies -
Report 1 mins
Findings from Aon's Global Risk Management Survey | Tenth Edition -
Article 4 mins
Four Steps to Develop Strong Property Risk Coverage in a Hardening Market -

Article 14 mins
Cutting Supply Chains: How to Achieve More Reward with Less Risk -

Article 9 mins
Driving Private Equity Value Creation Through Credit Solutions -
Article 7 mins
4 Steps to Help Take Advantage of a Buyer-Friendly Directors' & Officers' Market -
Article 9 mins
Managing Reputational Risks in Global Supply Chains -

Article 8 mins
How an Outsourced Chief Investment Officer Can Help Improve Governance and Manage Complexity -

Article 8 mins
Decarbonizing Your Business: Finding the Right Insurance and Strategy -

Article 8 mins
Reputation Analytics as a Leading Indicator of ESG Risk


Transaction Solutions Global Claims Study
Better Decisions Across Interconnected Risk and People Issues.
-

Report 5 mins
Chapter 1: Author’s Note & Executive Summary -

Report 8 mins
Chapter 2: North America: Highlights, Claims Severity and Frequency -

Report 3 mins
Chapter 3: North America: Breach Type and Notification -

Report 24 mins
Chapter 4: North America: Industry Sectors and Trends -

Report 5 mins
Chapter 5: North America: Tax Insurance Claims -

Report 5 mins
Chapter 6: EMEA: Highlights and Introduction -

Report 9 mins
Chapter 7: EMEA: Claim Frequency and Metrics -
Report 7 mins
Chapter 8: EMEA: Notifications by Target Location and Claims Severity and Payment Trends -

Report 10 mins
Chapter 9: EMEA: Breach Types and Trends -

Report 7 mins
Chapter 10: EMEA: Case Law, Insurer Survey, Claims Handling and Tax -

Report 6 mins
Chapter 11: APAC: Asia -

Report 9 mins
Chapter 12: APAC: Pacific


Weather
With a changing climate, organizations in all sectors will need to protect their people and physical assets, reduce their carbon footprint, and invest in new solutions to thrive. Our Weather Collection provides you with critical insights to be prepared.
-
Article 9 mins
Steering Trade and Supply Chains Amid Weather Challenges -
Podcast 9 mins
On Aon Podcast: Climate Impact on the Property and Casualty Market -

Alert 14 mins
L.A. Wildfires Highlight Urgent Need for Employee Support and Business Resilience -

Report 3 mins
2026 Climate and Catastrophe Insight -
Article 10 mins
How Public Entities and Businesses Can Use Parametric for Emergency Funding -
Podcast 12 mins
On Aon Podcast: Tackling Climate Risk to Build Economic Resilience -

Article 8 mins
Understanding Freeze Risk in a Changing Climate -
Podcast 9 mins
On Aon Podcast: Climate Science Through Academic Collaboration -
Article 6 mins
How Companies Are Using Climate Modeling to Improve Risk Decisions -
Article 8 mins
Using Parametric Insurance to Match Capital to Climate Risk -

Article 9 mins
Record Heatwaves: Protecting Employee Health and Safety


Workforce Resilience
Our Workforce Resilience collection gives you access to the latest insights from Aon's Human Capital team. You can reach out to the team at any time for questions about how we can assess gaps and help build a more resilience workforce.
