September 11, 2023 5 mins
Rising Losses From Severe Convection Storms Mostly Explained by Exposure Growth

Climate change or exposure growth? By understanding the drivers of increased severe convective storm loss volatility, reinsurers can better prepare for January 1 renewals.
Key Takeaways
-
From 1990 to 2022, severe convective storm losses increased at an annual rate of 8.9 percent.
-
Over 80 percent of the loss trend can be explained by exposure growth.
-
There is little evidence that climate change is impacting key atmospheric ingredients that influence SCS.
Seventy percent of global insured losses were driven by severe convective storms (SCS) in recent years. In the U.S., SCS caused $38 billion of insured loss in the first half of 2023, breaking the record of $33 billion set in the first half of 2011. From 1990 to 2022, SCS insured losses increased at an annual rate of 8.9 percent. As we enter January 1 (re)insurance renewals, it’s pertinent to understand what is driving this trend of SCS loss volatility. Is it climate change, where a warming planet contributes to a shift in weather patterns, resulting in a new normal of elevated storm activity? Or can the increased loss trend be explained by underlying exposure growth and population distribution changes?
We answer this question by first looking at the weather “ingredients” that are most favorable for severe thunderstorm development. The first is Convective Available Potential Energy, or CAPE, which is a measure of atmospheric instability and considered as a proxy for fuel available to a developing thunderstorm. The second variable is wind shear, a measure of wind speed and directional differences with height above the Earth’s surface. The product of these two measures is known as the Severe Index (SEV) and is commonly used to diagnose severe weather potential.
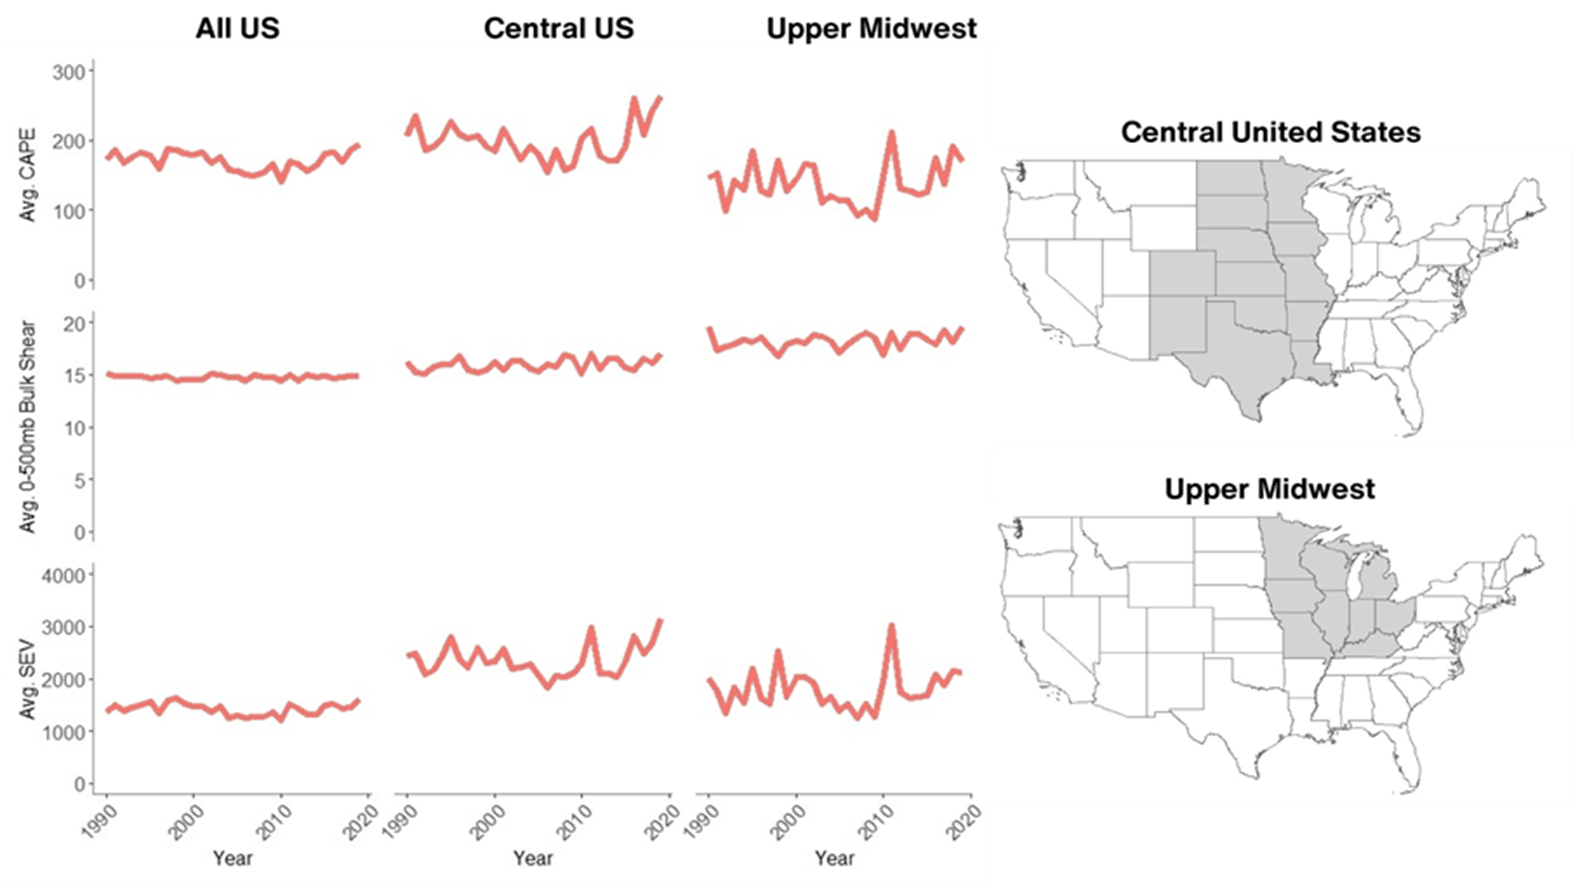
Severe weather ingredients from 1990-2019
The chart above shows annual averages for key SCS ingredients from 1990-2019. National Oceanic and Atmospheric Administration’s ERA5 reanalysis data, which is reported every six hours, was averaged through each year to determine the annual number. Other than some long term, decadal variation in CAPE observations in the Central U.S., there are no discernible trends in atmospheric ingredients that are most suitable for severe weather formation.
With the absence of physical drivers increasing severe convective storms, we can then assume that much of the SCS loss trend is due to underlying exposure changes. To prove this, we identified four main drivers of exposure change and quantified how much of the overall SCS loss trend they explained.
- Real gross domestic product (GDP) accounts for how much “stuff” there is in the economy and grew at an annual rate of 2.3 percent.
- Fixed reproducible tangible wealth (FRTW) accounts for how much goods and services are worth and grew at an annual rate of 2.1 percent.
- Property cost inflation, measured by the producer price index for all construction, provides a good estimate of how construction costs change over time. This grew the fastest at a 2.8 percent rate.
- Population distribution, measured by the housing distribution index, is based on changes over time in housing units in high hazard states like Texas and other Sun Belt states. It grew t a rate of 1.1 percent.
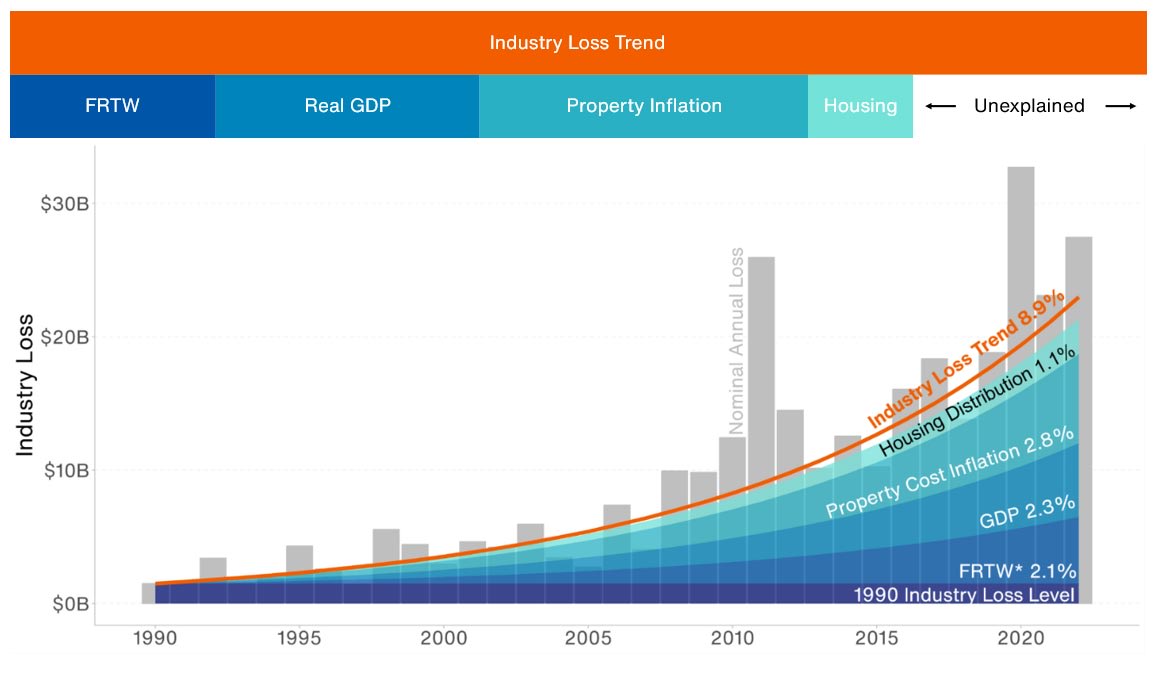
Nominal annual SCS losses and loss and exposure trends from 1990 to 2022
Source: Aon Analytics
Note: Nominal losses were subject to a $100 million (in 2006 dollars) threshold before being aggregated by year.
Overall, exposures have grown at a combined rate of 8.6 percent per year. Compared to the loss trend of 8.9 percent, and allowing for analysis uncertainty, this means that over 80 percent of SCS loss growth can be explained by exposure changes. The remaining 20 percent is unexplained by these metrics but could be due to small climate changes that are not discernible in the Severe Index, other exposure factors, or random chance.
While climate change has been shown to be a driving force behind evolving trends for other perils such as hurricane and heatwave, there is little evidence that climate change is impacting key variables that influence SCS. (Re)insurers instead must deal with growing exposures in high hazard areas, which can be managed through traditional risk management techniques, such as accumulation management, effective claims handling and appropriate deductible, limit and premium levels. Going forward, the industry’s emphasis for the SCS peril should be less on a changing climate and more on traditional risk management.
General Disclaimer
The information contained herein and the statements expressed are of a general nature and are not intended to address the circumstances of any particular individual or entity. Although we endeavor to provide accurate and timely information and use sources we consider reliable, there can be no guarantee that such information is accurate as of the date it is received or that it will continue to be accurate in the future. No one should act on such information without appropriate professional advice after a thorough examination of the particular situation.
Terms of Use
The contents herein may not be reproduced, reused, reprinted or redistributed without the expressed written consent of Aon, unless otherwise authorized by Aon. To use information contained herein, please write to our team.
Aon's Better Being Podcast
Our Better Being podcast series, hosted by Aon Chief Wellbeing Officer Rachel Fellowes, explores wellbeing strategies and resilience. This season we cover human sustainability, kindness in the workplace, how to measure wellbeing, managing grief and more.
-

Podcast 23 mins
Better Being Series: Understanding Burnout in the Workplace -
Podcast 14 mins
Better Being Series: Why Nutrition Matters -
Podcast 10 mins
Better Being Series: Discover the ‘Blue Zones’ Where People Live Longer -
Podcast 20 mins
Better Being Series: Improving Your Financial Wellbeing -
Podcast 17 mins
Better Being Series: Are You Taking Care of Your Digital Wellbeing? -
Podcast 19 mins
On Aon Podcast: Better Being Series Dives into Women’s Health -
Podcast 25 mins
On Aon’s Better Being Series: Managing Loss and Grief

Aon Insights Series Asia
Expert Views on Today's Risk Capital and Human Capital Issues
-

Article 8 mins
Thriving in an Interconnected World: How the C-Suite Embraces Uncertainty -

Article 6 mins
Powering Progress: Collaborating to Build a Sustainable Future in Emerging Markets -

Article 5 mins
Building Business Resilience: Key Steps to Effectively Integrate Risk Management Across Your Organisation -

Article 7 mins
Why Humans Are the Essential Factor in the Success of Artificial Intelligence (AI) -

Article 5 mins
Leveraging Research and Expertise to Strengthen Your HR Strategy for 2025 and Beyond -

Article 5 mins
Managing Risk on the Energy Transition Journey -

Article 7 mins
The Role of Risk Management in the Age of Generative Artificial Intelligence -

Article 7 mins
Finding A Way In Asia Pacific's New Economic Reality -

Article 4 mins
Three Ways to Boost Value from Benefits: APAC Insights from LinkedIn


Aon Insights Series Pacific
Expert Views on Today's Risk Capital and Human Capital Issues
-

Article 3 mins
Article Template to Duplicate

Aon Insights Series UK
Expert Views on Today's Risk Capital and Human Capital Issues
-

Article 2 mins
Introduction: Clarity and Confidence to Act Now -

Article 11 mins
Navigating a New Age of Macroeconomic Uncertainty -

Article 3 mins
Making Better Decisions — A C-Suite Perspective -

Article 3 mins
Understanding the Dynamics of Today’s Workforce — Reward, Retain, Evolve -

Article 3 mins
Artificial Intelligence — Managing the Risk and Potential -

Article 10 mins
Unlocking Balance Sheet Value to Empower Your Business Strategy -

Article 3 mins
Navigating the Unpredictable: Aon’s Suite of Actionable Analytics -

Article 4 mins
Redefining Risk Capital as a Business Enabler: Veolia's Innovative Approach -

Article 9 mins
A Data-Driven Approach to Better Workforce Decisions -

Article 5 mins
The Importance of Pay Transparency -

Article 6 mins
How Human Capital Data Enhances Risk Management for Financial Institutions -

Article 4 mins
The Battle for Top Talent in the Professional Services Sector -

Article 5 mins
Insights on a Volatile World — Risk Factors That Businesses Need to be Monitoring


Client Trends 2025
Better Decisions Across Interconnected Risk and People Issues.
-

Article 3 mins
Acknowledging Our Complex Reality -

Article 10 mins
Trade in a Technology-Driven Future -

Article 9 mins
How AI and Workforce will Intersect: Navigating Risks and Opportunities -

Article 8 mins
Weather and Workforce: Employers Must Quantify the Risk -

Article 9 mins
Steering Trade and Supply Chains Amid Weather Challenges -

Report 13 mins
Trade Issues Confront Global Businesses on Multiple Fronts -

Report 19 mins
Technology is Driving Firms to Harness Opportunities and Defend Against Threats -

Report 19 mins
Climate Analytics Unlock Capital to Protect People and Property -

Report 14 mins
A Workforce in Transition Prepares to Meet a Host of Challenges


Construction and Infrastructure
The construction industry is under pressure from interconnected risks and notable macroeconomic developments. Learn how your organization can benefit from construction insurance and risk management.
-

Article 8 mins
How North American Construction Contractors Can Mitigate Emerging Risks -

Article 7 mins
Managing Construction Risks: 7 Risk Advisory Steps -
Article 7 mins
Unlocking Capacity and Capital in a Challenging Construction Risk Market -

Article 7 mins
Protecting North American Contractors from Extreme Heat Risks with Parametric -
Article 5 mins
How Climate Modeling Can Mitigate Risks and Improve Resilience in the Construction Industry -

Report 1 mins
Construction Risk Management Europe Report 2023 -

Article 8 mins
Parametric Can Help Mitigate Extreme Heat Risks for Contractors in EMEA


Cyber Resilience
Our Cyber Resilience collection gives you access to Aon’s latest insights on the evolving landscape of cyber threats and risk mitigation measures. Reach out to our experts to discuss how to make the right decisions to strengthen your organization’s cyber resilience.
-

Article 8 mins
Cyber and E&O Market Conditions Remain Favorable Amid Emerging Global Risks -

Article 7 mins
How to Navigate AI-Driven Cyber Risks -

Article 9 mins
Building Resilience in a Buyer-Friendly Cyber and E&O Market -

Article 11 mins
A Middle Market Roadmap for Cyber Resilience -

Article 7 mins
Lessons Learned from the CrowdStrike Outage: 5 Strategies to Build Cyber Resilience -

Article 8 mins
Responding to Cyber Attacks: How Directors and Officers and Cyber Policies Differ -

Article 6 mins
Why Now is the Right Time to Customize Cyber and E&O Contracts


Employee Wellbeing
Our Employee Wellbeing collection gives you access to the latest insights from Aon's human capital team. You can also reach out to the team at any time for assistance with your employee wellbeing needs.
-

Article 8 mins
Employer Strategies for Cancer Prevention and Treatment -

Article 6 mins
The Long-Term Care Conundrum in the United States -

Article 9 mins
Developing a Paid Leave Strategy That Supports Workers and Their Families -

Article 9 mins
4 Ways to Foster a Thriving Workforce Amid Rising Health Costs -

Article 9 mins
The Next Evolution of Wellbeing is About Performance -

Article 6 mins
Three Ways Collective Retirement Plans Support HR Priorities -

Article 9 mins
How the Right Employee Wellbeing Strategy Impacts Microstress and Burnout at Work -
Podcast 13 mins
On Aon Podcast: The Future of Healthcare: Key Factors Impacting Medical Trend Rates -

Article 7 mins
Making Wellbeing Part of a Company’s DNA -

Article 7 mins
A Comprehensive Approach to Financial Wellbeing


Environmental, Social and Governance Insights
Explore Aon's latest environmental social and governance (ESG) insights.
Q4 2023 Global Insurance Market Insights
Our Global Insurance Market Insights highlight insurance market trends across pricing, capacity, underwriting, limits, deductibles and coverages.
-

Article 12 mins
Q4 2023: Global Insurance Market Overview -

Article 13 mins
Top Risk Trends to Watch in 2024


Global Risk Management Survey
Better Decisions Across Interconnected Risk and People Issues.
-

Report 28 mins
A New Era of Converging Risks and Accelerating Disruption -

Article 1 mins
Top 10 Global Risks -

Article 1 mins
Industry Insights: Findings from Aon's Global Risk Management Survey -

Article 1 mins
Regional Results -

Article 41 mins
Country-Level Findings -

Report 5 mins
Methodology and Respondent Demographics


Regional Results
How do the top risks on business leaders’ minds differ by region and how can these risks be mitigated? Explore the regional results to learn more.
-

Article 12 mins
Rethinking Resilience: Addressing Asia Pacific’s Top Risks -

Article 10 mins
Turning Uncertainty into Opportunity: Managing Risk in the EMEA Region -

Article 10 mins
Latin America’s Risk Landscape: Turning Complexity into Competitive Advantage -

Article 10 mins
Rethinking Resilience: Navigating North America’s Evolving Risk Landscape


Impact Report 2025
Explore Aon's corporate sustainability impact and strategy.
-

Article 7 mins
Executive Summary -

Article 13 mins
Aon’s Environmental Sustainability -

Article 15 mins
Supporting Energy Resilience and a Transition to a Low-Carbon Economy -

Article 20 mins
Our Commitment to Our Colleagues -

Article 8 mins
Our Community Impact -

Article 10 mins
Governance -

Article 8 mins
Cyber and Data Security -

Article 11 mins
Redefining Resilience


Top 10 Global Risks
Trade, technology, weather and workforce stability are the central forces in today’s risk landscape.
-

Article 6 mins
Cyber Risk: Turning Uncertainty into Opportunity -

Article 7 mins
Business Interruption: Managing Risk in an Interconnected World -

Article 6 mins
Why Economic Slowdown is an Ongoing Risk for Organizations -

Article 8 mins
Navigating Regulatory and Legislative Change -

Article 5 mins
Increasing Competition Is Intensifying Risk for Organizations -

Article 7 mins
Commodity Price Risk and Material Scarcity: An Escalating and Complex Risk -

Article 9 mins
Supply Chain or Distribution Failure: Navigating the New Normal -

Article 5 mins
Damage to Reputation or Brand: A Critical Risk -

Article 6 mins
Geopolitical Volatility: Preparing for the Unpredictable -

Article 6 mins
Cash Flow and Liquidity Risk: A Rising Challenge


Industry Insights
These industry-specific articles explore the top risks, their underlying drivers and the actions leaders are taking to build resilience.
-

Article 9 mins
Building Resilience to Support Growth in Construction and Real Estate -

Article 10 mins
Managing Risk and Unlocking Opportunity in the Food, Agribusiness and Beverage Industry -

Article 8 mins
Adapting to Disruption: How Financial Institutions are Reframing Risk -

Article 10 mins
Turning Risk into Resilience in the Industrials and Manufacturing Industry -

Article 11 mins
Navigating Risk in Insurance: Turning Complexity into Competitive Advantage -

Article 10 mins
Navigating Risk in Life Sciences: Building Resilience to Support Growth -

Article 11 mins
Navigating Volatility in Natural Resources: Risk Management as a Value Driver -

Article 10 mins
Navigating Risk in Transportation and Logistics: Gearing Up for Big Transitions -

Article 9 mins
Technology, Media and Communications: Rethinking Risk in a Shifting Landscape


Human Capital Analytics
Our Human Capital Analytics collection gives you access to the latest insights from Aon's human capital team. Contact us to learn how Aon’s analytics capabilities helps organizations make better workforce decisions.
-

Article 35 mins
5 Human Resources Trends to Watch in 2025 -
Article 13 mins
Medical Rate Trends and Mitigation Strategies Across the Globe -

Article 9 mins
3 Strategies to Help Avoid Workers Compensation Claims Litigation -
Podcast 15 mins
On Aon Podcast: Using Data and Analytics to Improve Health Outcomes -

Article 14 mins
How Technology Will Transform Employee Benefits in the Next Five Years -
Podcast 18 mins
On Aon Podcast: Technology Impacting the Future of Health and Benefits -

Article 10 mins
Designing Tomorrow: Personalizing EVP, Benefits and Total Rewards


Human Capital Quarterly Insights Briefs
Read our collection of human capital articles that explore in depth hot topics for HR and risk professionals, including using data and analytics to measure total rewards programs, how HR and finance can better partner and the impact AI will have on the workforce.
-

Article 12 mins
Total Rewards Strategies That Drive Business Outcomes -
Article 35 mins
5 Human Resources Trends to Watch in 2025 -

Article 20 mins
5 Ways HR Can Partner with Finance to Drive Growth -

Article 15 mins
How Artificial Intelligence is Transforming Human Resources and the Workforce -

Article 15 mins
Five Big Human Resources Trends to Watch in 2024 -
Article 10 mins
Designing Tomorrow: Personalizing EVP, Benefits and Total Rewards -

Article 10 mins
How Data and Analytics Can Optimize HR Programs -

Article 15 mins
Get Ready for the Top 5 HR Trends in 2023


Insights for HR
Explore our hand-picked insights for human resources professionals.
-

Article 7 mins
COVID-19 has Permanently Changed the Way We Think About Wellbeing -
Article 10 mins
How Data and Analytics Can Optimize HR Programs -

Article 7 mins
Case Study: The LPGA Unlocks Talent Potential with Data -

Article 10 mins
Navigating the New EU Directive on Pay Transparency -

Article 6 mins
Rethinking Your Total Rewards Programs During Mergers and Acquisitions


Workforce
Our Workforce Collection provides access to the latest insights from Aon’s Human Capital team on topics ranging from health and benefits, retirement and talent practices. You can reach out to our team at any time to learn how we can help address emerging workforce challenges.
-
Article 8 mins
Weather and Workforce: Employers Must Quantify the Risk -
Article 12 mins
Total Rewards Strategies That Drive Business Outcomes -

Article 8 mins
AI and Workforce Skills: Who Should Act and Why Now? -

Article 19 mins
3 Strategies to Promote an Inclusive Environment and Bridge the Gender Gap -
Article 8 mins
2025 Salary Increase Planning Tips -
Article 12 mins
People Risks Are Rising: Here’s How U.S. Benefits Are Stepping Up -
Article 8 mins
Employer Strategies for Cancer Prevention and Treatment -

Article 6 mins
Taking a Data-Led Approach to Job Architecture to Accelerate Pay Transparency -
Podcast 12 mins
Better Being Series: Building Sustainable Performance in a Multi-Generational Workforce -

Article 7 mins
Key Trends in U.S. Benefits for 2025 and Beyond -

Article 7 mins
Why Pay Transparency Demands a Total Rewards Lens -
Article 9 mins
4 Ways to Foster a Thriving Workforce Amid Rising Health Costs


Mergers and Acquisitions
Our Mergers and Acquisitions (M&A) collection gives you access to the latest insights from Aon's thought leaders to help dealmakers make better decisions. Explore our latest insights and reach out to the team at any time for assistance with transaction challenges and opportunities.
-
Article 6 mins
Rethinking Your Total Rewards Programs During Mergers and Acquisitions -

Article 9 mins
Organizational Design and Talent Planning are Key to M&A Success -

Article 5 mins
Project Management for HR: The Secret Behind a Successful M&A Deal -

Article 8 mins
Cultural Alignment Planning Drives M&A Success -

Report 1 mins
A Guide to Maximizing Value in Post-Merger Integrations -

Report 2 mins
The ABC's of Private Equity M&A: Deal Flow Impacts of Al, Big Tech and Climate Change -
Article 11 mins
The Silver Lining on M&A Deal Clouds: M&A Insurance Insights from 2023


Natural Resources and Energy Transition
The challenges in adopting renewable energy are changing with technological advancements, increasing market competition and numerous financial support mechanisms. Learn how your organization can benefit from our renewables solutions.
-

Article 4 mins
5 Steps for Successful Carbon Accounting Verification -

Article 6 mins
AI Innovations in Renewable Energy: Transforming the Sector -

Article 11 mins
Securing Human Capital in Natural Resources -

Article 6 mins
Decarbonizing Construction for a Low-Emission Future


Navigating Volatility
How do businesses navigate their way through new forms of volatility and make decisions that protect and grow their organizations?
Parametric Insurance
Our Parametric Insurance Collection provides ways your organization can benefit from this simple, straightforward and fast-paying risk transfer solution. Reach out to learn how we can help you make better decisions to manage your catastrophe exposures and near-term volatility.
-

Article 10 mins
How Public Entities and Businesses Can Use Parametric for Emergency Funding -

Article 6 mins
Parametric Insurance: A Complement to Traditional Property Coverage -

Article 8 mins
Using Parametric Insurance to Match Capital to Climate Risk -

Article 6 mins
Using Parametric Insurance to Close the Earthquake Protection Gap -
Article 5 mins
How Technology Enhancements are Boosting Parametric


Pay Transparency and Equity
Our Pay Transparency and Equity collection gives you access to the latest insights from Aon's human capital team on topics ranging from pay equity to diversity, equity and inclusion. Contact us to learn how we can help your organization address these issues.
-
Article 6 mins
Taking a Data-Led Approach to Job Architecture to Accelerate Pay Transparency -
Article 19 mins
3 Strategies to Promote an Inclusive Environment and Bridge the Gender Gap -

Report 1 mins
The 2024 North America Pay Transparency Readiness Study -

Article 10 mins
How Financial Institutions can Prepare for Pay Transparency Legislation -

Article 8 mins
Pay Transparency Can Lead to Better Equity Across Benefits -

Article 12 mins
Understanding and Preparing for the Rise in Pay Transparency -
Podcast 14 mins
On Aon Podcast: Understanding Pay Transparency Regulations -
Article 10 mins
Navigating the New EU Directive on Pay Transparency -

Article 6 mins
To Disclose Pay or Not? How Companies are Approaching the Pay Transparency Movement -
Podcast 19 mins
On Aon Podcast: Better Being Series Dives into Women’s Health -

Article 11 mins
Advancing Women’s Health and Equity Through Benefits and Support


Property Risk Management
Forecasters are predicting an extremely active 2024 Atlantic hurricane season. Take measures to build resilience to mitigate risk for hurricane-prone properties.
-
Article 8 mins
Florida Hurricanes Not Expected to Adversely Affect Property Market -

Article 10 mins
Build Resilience for an Extremely Active Atlantic Hurricane Season -

Article 4 mins
Four Steps to Develop Strong Property Risk Coverage in a Hardening Market -
Podcast 16 mins
On Aon Podcast: Navigating and Preparing for Catastrophes -
Article 6 mins
Parametric Insurance: A Complement to Traditional Property Coverage -

Article 4 mins
Navigating Climate Risk Using Multiple Models and Data Sets -

Article 5 mins
Rising Losses From Severe Convection Storms Mostly Explained by Exposure Growth -
Article 6 mins
Using Parametric Insurance to Close the Earthquake Protection Gap


Technology
Our Technology Collection provides access to the latest insights from Aon's thought leaders on navigating the evolving risks and opportunities of technology. Reach out to the team to learn how we can help you use technology to make better decisions for the future.
-
Article 9 mins
How AI and Workforce will Intersect: Navigating Risks and Opportunities -

Article 23 mins
The AI Data Center Boom: Strategies for Sustainable Growth and Risk Management -
Article 8 mins
AI and Workforce Skills: Who Should Act and Why Now? -
Article 7 mins
How Technology is Transforming Open Enrollment in the U.S. -

Article 15 mins
Navigating Cyber Risks in EMEA: Key Insights for 2025 -
Article 7 mins
How to Navigate AI-Driven Cyber Risks -
Article 15 mins
How Artificial Intelligence is Transforming Human Resources and the Workforce -
Podcast 9 mins
On Aon Podcast: How has CrowdStrike Changed the Cyber Market? -

Article 18 mins
5 Ways Artificial Intelligence can Boost Claims Management -

Article 12 mins
Navigating AI-Related Risks: A Guide for Directors and Officers -
Article 5 mins
How Technology Enhancements are Boosting Parametric -

Article 7 mins
How to Futureproof Data and Analytics Capabilities for Reinsurers


Trade
Our Trade Collection gives you access to the latest insights from Aon's thought leaders on navigating the evolving risks and opportunities for international business. Reach out to our team to understand how to make better decisions around macro trends and why they matter to businesses.
-
Article 10 mins
Trade in a Technology-Driven Future -
Podcast 9 mins
Special Edition: Global Trade and its Impact on Supply Chain -

Article 8 mins
The Evolving Threat of Cargo Theft: 5 Key Mitigation Strategies -
Report 1 mins
Findings from Aon's Global Risk Management Survey | Tenth Edition -
Article 4 mins
Four Steps to Develop Strong Property Risk Coverage in a Hardening Market -

Article 14 mins
Cutting Supply Chains: How to Achieve More Reward with Less Risk -

Article 9 mins
Driving Private Equity Value Creation Through Credit Solutions -
Article 7 mins
4 Steps to Help Take Advantage of a Buyer-Friendly Directors' & Officers' Market -
Article 8 mins
Managing Reputational Risks in Global Supply Chains -

Article 8 mins
How an Outsourced Chief Investment Officer Can Help Improve Governance and Manage Complexity -

Article 8 mins
Decarbonizing Your Business: Finding the Right Insurance and Strategy -

Article 8 mins
Reputation Analytics as a Leading Indicator of ESG Risk


Transaction Solutions Global Claims Study
Better Decisions Across Interconnected Risk and People Issues.
-

Report 5 mins
Chapter 1: Author’s Note & Executive Summary -

Report 8 mins
Chapter 2: North America: Highlights, Claims Severity and Frequency -

Report 3 mins
Chapter 3: North America: Breach Type and Notification -

Report 24 mins
Chapter 4: North America: Industry Sectors and Trends -

Report 5 mins
Chapter 5: North America: Tax Insurance Claims -

Report 5 mins
Chapter 6: EMEA: Highlights and Introduction -

Report 9 mins
Chapter 7: EMEA: Claim Frequency and Metrics -
Report 7 mins
Chapter 8: EMEA: Notifications by Target Location and Claims Severity and Payment Trends -

Report 10 mins
Chapter 9: EMEA: Breach Types and Trends -

Report 7 mins
Chapter 10: EMEA: Case Law, Insurer Survey, Claims Handling and Tax -

Report 6 mins
Chapter 11: APAC: Asia -

Report 9 mins
Chapter 12: APAC: Pacific


Weather
With a changing climate, organizations in all sectors will need to protect their people and physical assets, reduce their carbon footprint, and invest in new solutions to thrive. Our Weather Collection provides you with critical insights to be prepared.
-
Article 9 mins
Steering Trade and Supply Chains Amid Weather Challenges -
Podcast 9 mins
On Aon Podcast: Climate Impact on the Property and Casualty Market -

Alert 14 mins
L.A. Wildfires Highlight Urgent Need for Employee Support and Business Resilience -

Report 3 mins
2026 Climate and Catastrophe Insight -
Article 10 mins
How Public Entities and Businesses Can Use Parametric for Emergency Funding -
Podcast 12 mins
On Aon Podcast: Tackling Climate Risk to Build Economic Resilience -

Article 5 mins
Understanding Freeze Risk in a Changing Climate -
Podcast 9 mins
On Aon Podcast: Climate Science Through Academic Collaboration -
Article 6 mins
How Companies Are Using Climate Modeling to Improve Risk Decisions -
Article 8 mins
Using Parametric Insurance to Match Capital to Climate Risk -

Article 9 mins
Record Heatwaves: Protecting Employee Health and Safety


Workforce Resilience
Our Workforce Resilience collection gives you access to the latest insights from Aon's Human Capital team. You can reach out to the team at any time for questions about how we can assess gaps and help build a more resilience workforce.

More Like This
-

Article 9 mins
Insurers’ Opportunities in M&A: The Rise of Hybrid Growth Pathways
As insurance consolidation becomes more selective, insurers are looking beyond full acquisition as the default route to growth. Hybrid pathways may provide capital-efficient access to capabilities and talent, while requiring careful management of governance, execution and alignment risks.
-

Article 17 mins
Insurers’ Opportunities in M&A: When Buying Fits, When Building Wins
Insurers’ growth decisions are entering a more complex phase. As markets soften, capital costs rise and structured volatility pressures balance sheets, insurers are reassessing when consolidation creates real value — and when organic or alternative strategies may deliver better outcomes.
-

Article 8 mins
People Mobility in a Complex Global Environment
International employee and expat assignments remain popular despite headwinds. Employers looking to develop their employees’ skills and distribute talent can take advantage of the opportunities revealed by these challenges.
-

Article 8 mins
Healthcare Cost Increases Show No Signs of Slowing: What Employers Can Do
While the current environment is challenging, there are new options and strategies to contain costs and support employees.
-

Article 8 mins
SPACs Return: Why D&O Risk Management Must Step Up
SPACs are staging a comeback, but the risks that surrounded them in prior cycles remain. The challenge is to lead with proactive, strategic risk transfer that keeps stakeholders and balance sheets protected in a fast-evolving landscape.
-

Article 4 mins
Responding to Retirement Plan Complexity: A Guide for Mid-Market Employers
Employee retirement plans are getting more complex. Mid-market employers with lean HR teams must maintain consistent compliance and governance processes before small issues turn into costly corrections, penalties or employee trust issues.
-

Article 8 mins
How AI and Data are Transforming Employee Benefits Platforms
Employee benefits and total rewards platforms are redefining the employee experience through the combination of connected data, intelligent delivery and new technology. This trend is fundamentally changing how employees understand, access and use their benefits.
-
Article 4 mins
Casualty Risk Is Rewriting Balance Sheet Exposure
Liability severity is rising, volatility is increasing and many companies are retaining more casualty risk than they were a decade ago – often without changing how that exposure is measured, financed or reflected in capital decisions.
-

Article 10 mins
Cyber Risk is Growing Faster Than Risk Transfer
Cyber investment has grown rapidly, but insurance remains a marginal share of total cyber spend. As cyber losses drive larger operational and financial outcomes, many organizations continue to retain significant volatility on their balance sheets.
-

Article 2 mins
Defined Contribution in 2026: Rethinking the DC Operating Model
People are living longer and defined contribution plans play a central role in retirement security. This report explores what's changing and how employers can adapt to deliver better outcomes for their workforces.
-

Article 10 mins
Navigating Risk Across the Clean Energy Lifecycle from Design to Decommissioning
Clean energy investment is rising, but so are delivery, performance and financial risks. Scaling wind, solar and storage depends on lifecycle resilience that integrates people, engineering standards and risk transfer from design through long-term operations.
-

Article 9 mins
Hull and Machinery Risk: How Technical Management and Execution Shape Outcomes
Global shipowners and operators face increasing complexity from geopolitical tensions, older fleets, volatile weather, crewing challenges and evolving regulations. Disciplined technical management is now more important to loss performance, resilience and long-term operating strength.
-

Article 11 mins
AI Isn’t the Differentiator. Workforce Readiness Is
AI is rapidly reshaping how work gets done and where value is created, yet many organizations are not translating their investment into business outcomes. Closing the gap between deployment and impact requires a focus on workforce readiness and aligning people strategy to performance.
-

Article 8 mins
Why Third-Party Cyber Risk is a Balance Sheet Issue
Many organizations assume contracts or insurance transfer third-party cyber risk until a disruption proves otherwise. Limiting financial fallout requires treating third-party exposure as a capital and resilience issue, with direct implications for earnings, cash flow and balance sheets.
-

Article 4 mins
Aon 2025/26 Global Pension Risk Survey
Explore how pension sponsors and leaders are responding to investment volatility, the latest regulations and operational pressures in Aon’s 2025–26 Global Pension Risk Survey.
-

Article 4 mins
New Strategies to Manage Rising Pharmacy Costs
Specialty drugs and GLP 1s are on the rise, changing the landscape of employee pharmacy benefits. Discover new strategies to better understand and manage pharmacy costs.
-

Article 5 mins
Four Considerations for Evolving Work with AI
Many companies face pressure to shrink workforces, but people‑first strategies can realize AI’s value while preserving strength and talent. Explore workforce design that empowers employees and unlocks the full value of AI.
-
Article 4 mins
Q&A: How Are Employers Supporting High-Cost Claimants While Managing Costs?
High-cost claimants continue to drive a disproportionate share of healthcare spend and volatility. Aon’s 2026 Health Survey shows how employers are responding, and where there are opportunities to manage costs without eroding support for employees in the future.
-

Article 13 mins
Tax Credit and Credit Insurance as Financing Enablers for U.S. Digital Infrastructure
Data centers, as part of U.S. digital infrastructure, face a tighter power market as clean energy tax credits become binary and time-bound.
-

Article 11 mins
Managing Renewable Construction Claims with Confidence
Construction-phase claims are rising as renewable projects grow larger, more complex and more exposed. Understanding where risk concentrates and how earlier, integrated decisions can reduce loss is central to delivery certainty, financing confidence and long-term insurability.
-

Article 5 mins
You Paid for AI Cyber Protection. Have You Priced What Happens When it is Wrong?
AI-driven cyber controls promise speed and precision, but when high-privilege automation is wrong or manipulated the real risk shows up on your P&L in your governance and at your next renewal.
-
Article 6 mins
Why 2026 Hurricane Preparedness Requires More Than a Forecast
A quieter 2026 hurricane season is possible, but risk remains. North American organizations, however, have a window to strengthen resilience. Combining exposure data with real-time analytics, claims readiness and resilience measures can help provide a strategic advantage for protecting assets.
-

Article 6 mins
Surplus Trust Assets: Trap or Opportunity?
As pension funding levels rise, surplus assets increasingly represent both opportunity and risk. A strategic framework for effective surplus decision making outlines how sponsors can evaluate durability, constraints and efficiency before pursuing any surplus strategy.
-
Article 6 mins
Preparing HR for the Next Phase of Pay Transparency
Momentum is building for pay transparency. As regulations emerge, employers are shifting their focus to communications and manager training, with a growing number viewing pay transparency as a strategic differentiator.
-

Article 8 mins
Demystifying Retirement Management for Multinational Employers
For multinational employers, global retirement management turns shared principles into consistent governance. This can result in improved retirement outcomes across countries.
-
Article 7 mins
How Can HR and the C‑Suite Align on Healthcare Costs?
Rising healthcare costs are an enterprise issue for employers. Organizations know they need to take urgent action but often lack alignment on how. Understanding C-Suite perspectives and learning how to collaborate is critical.
-
Article 15 mins
Evaluating Labor-Friendly Investment Strategies for Taft-Hartley Plans
Taft Hartley plans sit at the intersection of fiduciary duty and labor priorities. As interest in labor friendly investments grows, plan fiduciaries must only consider them while remaining firmly grounded in ERISA requirements.
-
Article 5 mins
The Risk You Already Own: Financing Digital Asset Exposure with a Captive
As digital asset exposure scales faster than most institutions’ risk frameworks, leading firms are using captives to turn unstructured retention into deliberate, capital-efficient strategy.
-

Article 8 mins
Why the Aging Workforce Demands a New Employer Strategy
As people work longer, employers that connect talent, health and retirement strategies will be best positioned to protect critical skills, manage health costs and avoid unplanned workforce exits.
-
Article 13 mins
AI Risk 2026: What Business Leaders Need to Know
The accelerating role of artificial intelligence in organizational decision making in 2026 is redefining exposure — from fraud to operational resilience. Leaders must strengthen controls, build clear accountability, and ensure their risk and insurance programs keep pace with AI‑driven threats.
-
Article 5 mins
Managing Global Benefits During Divestiture
As more organizations divest non-core operations, a critical challenge has emerged — establishing fit-for-purpose, cost-effective employee benefits for newly formed businesses in compressed timeframes. Effective solutions exist that simplify and accelerate implementation.
-

Article 5 mins
A New Pension Roadmap for Plan Sponsors
Defined benefit (DB) pension plan management has entered a new era. Learn more about the different tools and approaches plan sponsors need to meet their long-term goals.
-
Article 11 mins
Bridging the Gap: Solutions for Managing Construction-to-Operation Transition Risk
Construction-to-operation transitions are rarely seamless. Without clear responsibilities, precise handover definitions and aligned insurance structures, critical risks can fall through the cracks — but early coordination can help.
-

Article 9 mins
Exploring the DC OCIO Model
DC OCIO can save plan sponsors time, lessen fiduciary risk, and deliver potential fee savings all with the goal of enhancing participant outcomes
-
Article 28 mins
Q1 2026: Global Insurance Market Overview
Buyer friendly conditions continued into Q1 2026, underpinned by strong insurer performance and capacity availability, while rising geopolitical risks and other structural pressures introduced greater complexity beneath the surface.
-

Article 5 mins
Liquidity Under Pressure: Capital Allocation Decisions in the Middle Market
Rising costs, tighter insurance markets and more synchronized volatility are reshaping how North American middle market CFOs think about liquidity. The challenge is not just how much cash to hold but how to allocate it effectively under pressure.
-
Article 5 mins
4 Ways Analytics are Redefining North American Nat Cat Resilience
Natural catastrophe risk is now a persistent, financially material challenge for North American organizations. Advanced analytics help risk leaders quantify volatility, align decisions with risk appetite and strengthen resilience amid uncertainty.
-

Article 13 mins
Beyond Traditional Markets: Unlocking Alternative Risk Capital Solutions
Alternative risk capital solutions are increasingly important as organizations face complex, capital-intensive exposures and capacity constraints. Advances in modeling and diagnostics now help investors participate with confidence, supporting stronger resilience.
-

Article 9 mins
Pay Transparency Is Coming for Insurance. The Question Is: Are You Ready – or Just Hoping to Be?
Pay transparency is no longer a future consideration for insurers – it is a fast‑approaching test of governance, data discipline and leadership credibility. While the EU Pay Transparency Directive is the immediate trigger, its implications are global
-

Article 8 mins
Reputation as a Value Driver: Strengthening Resilience in Oil & Gas
Oil and gas companies face heightened scrutiny from governments, regulators, investors and consumers amid escalating geopolitical tensions. In this environment, reputational resilience is critical to protecting value, securing insurance and maintaining trust as energy security takes priority.
-

Article 11 mins
The AI Governance Frontier in Investment Management
Based on responses from 125+ investment managers, it’s clear that AI use in today’s market is now becoming mainstream and an AI governance maturity curve is emerging.
-

Article 9 mins
Building Tomorrow’s Grid: Managing Extreme Heat Risk in a Warming World
Extreme heat from climate change is increasingly threatening U.S. energy supply and reliability – forcing energy companies to take steps to safeguard operations and meet rising demand.
-

Article 11 mins
Natural Catastrophe Exposure: A Critical Inflection Point for Digital Infrastructure
Natural catastrophe risk is becoming a defining constraint of digital infrastructure development. Early planning decisions can make or break insurability — dictating how facilities withstand extreme weather and secure insurance capacity in a rapidly expanding market.
-
Article 5 mins
Converging Geopolitical and Enterprise Risks in Energy: What Leaders Need to Anticipate Now
Learn how energy leaders can map geopolitical shocks, align risk and compliance and use scenario modeling to build resilient, opportunity-ready portfolios.
-

Article 8 mins
When an Employee Benefits Captive is the Right Solution
Amid rising costs and a desire for more health data insights, companies are increasingly turning toward captive arrangements for their employee benefits. Here are the drivers of this movement, and how employers can decide if a captive is right for their employee benefits.
-

Article 5 mins
How AXA XL Transformed into a Skills-Based Organization
AXA XL, a subsidiary of the insurer and reinsurer AXA, wanted to capitalize on the talent they had in their organization in the face of a complex series of challenges. Working with Aon, AXA XL was able to future-proof its organization and ensure it can meet future workforce needs.
-

Article 7 mins
Global Growth for the Future: Metals and Mining
Mining is essential to global growth, yet rising demand, capital challenges, workforce shifts and geopolitical pressure are reshaping the sector. Leaders must strengthen capital, talent, technology and ESG resilience to meet future needs.
-
Article 11 mins
Clarity in the Era of Megaprojects: Rethinking Performance Security
As megaprojects scale and risk capital tightens, clarity has become central to effective performance security. Understanding how surety capacity, performance bonds, bank guarantees, instruments and regional requirements interact helps preserve liquidity, protect margins and deliver complex projects.
-

Article 6 mins
Measuring What Matters: Culture as the Foundation of AI Readiness
As AI transforms everyday work and skills, establishing a strong organizational culture helps build the employee trust needed to openly navigate new tools and embrace change as an opportunity for growth.
-

Article 10 mins
Reimagining Primary Care Through Collaboration
Aon Accelerate Lab insights on strengthening primary care as the coordinating hub of employer healthcare to improve access, outcomes and employee experience.
-
Article 13 mins
Three Roles to Build Insurance’s Next-Generation Workforce
As automation, climate risk, and shifting workforce expectations reshape insurance, building a future-fit talent strategy is now the industry’s defining challenge.
-

Article 5 mins
Property Risk in Natural Resources: The Shift from Severity to Duration
Climate volatility, asset concentration and extended rebuild timelines are reshaping property risk in natural resources. The defining exposure is no longer just how large a loss could be, but how long disruption could last and how that volatility flows through the balance sheet.
-

Article 14 mins
Building Bankable, Resilient Data Centers: From Site to Operation
Data center spending will reach $6.7 trillion by 2030, according to McKinsey.<sup>1</sup> With significant capital on the line, facilities demand a new lifecycle approach to risk that strengthens bankability, protects schedules and delivers operational resilience from day one.
-
Article 5 mins
What Multinational Employers Need to Know About GLP-1s
GLP-1 medicines for weight loss are increasingly popular in the U.S., prompting employers to consider coverage for employees. While not as common yet globally, GLP-1s spark a broader discussion around using data and analytics to identify health risks and address obesity as a disease.
-

Article 5 mins
Defensible Casualty Decisions in a Volatile, Data-Heavy World
As casualty volatility increases and financial scrutiny intensifies, risk leaders must do more than structure insurance programs. They must quantify and communicate how limits, retentions and program design align with enterprise risk tolerance and capital strategy.
-

Article 4 mins
Pooled Employer Plans as a Strategic Differentiator, with Saalex Corporation
Saalex, a U.S.-based government contractor, understands the value of employee benefits in attracting and retaining top talent. After a complete review of benefits, they were interested in the cost savings, administrative efficiencies and added benefits of a pooled employer program.
-

Article 4 mins
How to Uncover Hidden Costs in Employee Retirement Plans
Uncovering hidden costs is essential, not just for today’s balance sheet, but for securing the financial future of organizations and their retirees.
-
Article 8 mins
How AI, Cost Pressures and Reskilling are Transforming Talent Strategies
AI acceleration, rising healthcare costs and changes to workforce skills are transforming organizations. Our analysis of financial services, life sciences and technology companies provides insights on how to redesign roles, reskill at scale and reimagine talent strategies to stay competitive.
-
Article 6 mins
Strategies for Closing the Gender Retirement Pay Gap
Addressing the retirement pay gap issue between men and women starts with first acknowledging it exists. Then companies can conduct further analysis and adjust their benefit plans accordingly.
-

Article 10 mins
Unlock the Potential of Alternative Investments with an Outsourced Chief Investment Officer
Avoid limiting a portfolio’s capacity based on the capabilities or bandwidth of an existing process by working with the right partner.
-

Article 10 mins
Industrials and Manufacturing: A Risk Management Approach to Transform Workforce Risk into Workforce Resilience
Workforce-related risks — spanning health, benefits, safety systems, and data and analytics — are not just operational concerns but strategic drivers. When activated, they positively shape the total cost of risk and long-term resilience for industrials and manufacturing organizations.
-

Article 8 mins
Navigating the DB Pension Endgame: Lessons from Global Leaders
Rising longevity, shifting demographics and ongoing regulatory reform are reshaping defined benefit pension strategies. As legacy plans wind down, lessons from mature markets offer practical guidance for managing the final stage of a pension scheme’s journey: the endgame.
-
Article 7 mins
Managing Technological Risk in the Age of Advanced Gas Turbines
As the digital economy accelerates, driven by AI and cloud computing, the U.S. power sector faces a new era of demand. Advanced gas turbines are at the heart of this transformation, but their rapid evolution brings complex risks.
-
Article 24 mins
Q4 2025: Global Insurance Market Overview
Soft market conditions, ample capacity and heightened competition continued across most geographies and lines in Q4 — giving insurance buyers opportunities to secure better pricing, improve terms and expand coverage.
-

Article 17 mins
2026 P&C Outlook: Navigating Volatility, Unlocking Growth
A dynamic and interconnected property & casualty risk landscape persists in 2026. However, the insurance market presents ample capacity and opportunities for buyers. Yet, increasing volatility means the window to build long-term resilience is time sensitive in advance of the next market turn.
-
Article 9 mins
Policy Alert: New U.S. Executive Order on Artificial Intelligence – Aon Tips for Better Risk Capital Decisions
On December 11, 2025, U.S. President Donald J. Trump released a new Federal Executive Order — the latest effort towards the aggressive promotion of U.S. AI leadership and away from a fragmented, state-by-state regulatory model.
-

Article 10 mins
Retirement Resilience in FAB: Inclusive Pension Plan Design for a Diverse and Decentralized Workforce
By combining inclusive pension plan design with targeted engagement strategies, FAB organizations can close the retirement readiness gap and build long-term resilience for all employees.
-
Article 8 mins
Strengthening Workforce Resilience in a Changing Climate
Extreme weather poses growing risks to business operations and workforce resilience. Employers must go beyond reactive measures to protect employees and proactively plan for more frequent and widespread extreme events.
-
Article 13 mins
Cyber 2026: Evolving Threats Demand Strategic Leadership
In 2026, AI-driven threats and regulatory pressures make cyber risk a board-level priority. Now is the time for leaders to act decisively — strengthening resilience and leveraging a favorable insurance market.
-

Article 10 mins
Data in Supply Chains: Turning Insights into Action
Organizations have access to more supply chain risk data than ever — yet few use it to its potential. Leaders who turn the wealth of available information into actionable insight set the standard for effective, data-driven supply chain risk management.
-

Article 6 mins
From Threats to Tools: Evolving Risk Functions in Financial Institutions
The risk management playbook is being rewritten as financial institutions navigate an era of heightened complexity and rapid change.
-

Article 28 mins
2026 Human Capital Outlook: 5 Forces to Act on
As workforce expectations rise and business risks intensify, HR leaders must act on five forces shaping 2026 — from AI and skills to healthcare costs, analytics, pay transparency and retirement readiness. Discover how to build a strategy that balances performance, cost and experience.
-

Article 10 mins
From Compliance to Competitiveness: Sustainability for Finance Leaders
Sustainability is no longer reputational. It’s a strategic priority within risk and capital management, powered by robust data, innovation and industry expertise. For finance leaders, embedding sustainability into decision making can be critical to secure long-term value and earn stakeholder trust.
-

Article 12 mins
Workforce-Focused Analysis on GLP-1s: Phase Two Findings
Explore second-phase GLP-1 study insights on improved medical cost growth, adherence and women’s health.
-

Article 15 mins
Nuclear Energy Revival: Risk, Resilience and the Talent Revolution
Nuclear is a critical pillar of the energy transition, addressing the dual challenges of decarbonization and surging demand. Success will hinge on managing risks across new generation technologies, regulatory shifts, financial model changes, supply chain challenges — and the acute war for talent.
-

Article 9 mins
From Volatility to Value: Multi-Year Casualty Insurance and Structured Risk Solutions
In today’s volatile casualty market, businesses face mounting uncertainty from rising loss exposures and shifting risk transfer dynamics. Multi-year structured programs and other alternative risk transfer solutions can offer a smarter way to align risk duration with capital strategies.
-

Article 11 mins
The Digital Claims Transformation: What Risk Leaders Need to Know
As digital claims transformation accelerates, organizations are adopting AI, automation and analytics to improve speed, transparency and accuracy — and unlock deeper insights into risk profiles, enhancing long-term resilience.
-

Article 3 mins
U.S. Pension Risk Transfer (PRT): Annual Report Preview
U.S. pension risk transfer activity strengthened in late 2025, supported by competitive pricing and growing interest in buy-ins.
-

Article 6 mins
A Streamlined Retirement Solution for Spin-Off Organizations
Pooled employer plans (PEPs) can offer a streamlined solution to the retirement planning challenges inherent in spin-off and M&A events.
-
Article 4 mins
5 Myths You Need to Stop Believing About Litigation (and 7 Ways to Avoid It)
Litigation from workers’ compensation and liability claims is not inevitable. Discover common myths and seven practical strategies using prevention, documentation, and AI to help avoid lawsuits and protect your organization.
-

Article 7 mins
Credit Insurance and The Future of Energy
In a conversation with Trade Finance Global’s Deputy Editor, Mahika Ravi Shankar, Madeleine Whiteley, Senior Client Manager at Aon, explored how credit insurance is helping energy clients navigate volatility, adapt to the transition to renewables, and manage the uncertainties of today’s market.
-

Article 12 mins
Life Sciences at the Crossroads: Innovation, Access and Rising Healthcare Costs
Innovation has always driven growth in life sciences. Yet today, it’s not enough to keep organizations relevant and resilient. As global healthcare changes rapidly, the future of care depends on how well leaders align their breakthroughs with real-world healthcare delivery, affordability and trust.
-

Article 9 mins
As Health Spend Soars, Employers Should Beware of Hidden Cost Threats
While cancer care and specialty medicines are familiar culprits behind rising U.S. healthcare costs, benefit leaders should also watch out for less obvious factors driving up expenses. Taking a holistic view requires being aware of these hidden threats as you work to manage costs.
-
Article 8 mins
Optimizing Your Property Program: 3 Ways Analytics Can Deliver Better Outcomes
Advanced analytics empower forward-thinking risk leaders to secure better terms, anticipate volatility and build resilience. Explore three strategies to future-proof your property program through analytics.
-

Article 7 mins
Trump Administration Prescription Drug Initiatives: What Employers Should Know
The Trump Administration has introduced several initiatives aimed at reducing prescription drug costs. Here’s what these changes could mean for employer-sponsored plans.
-

Article 8 mins
Risk Factors and Conditions Driving the Global Medical Trend Rate
The global medical trend rate is projected to dip below double digits for the first time in three years to 9.8%. It may be a hopeful sign that cost increases have plateaued, but cost increases are still elevated. We explain the risks and conditions behind the increase so employers can prepare.
-

Article 9 mins
6 Insights to Build Risk Resilience in a Volatile Retail Market
Retailers in North America are navigating intense competition, shifting consumer demands and rising costs. Add to that a wave of evolving risks — from cyber to litigation — and the pressure mounts. These six insights can help retailers rethink their risk strategy.
-

Article 8 mins
Cyber Risk is the Weak Link in Data Center Construction
Data center construction is booming — but cyber risk management hasn’t kept pace. As digital infrastructure becomes ever more critical, fit-for-purpose insurance solutions are essential to protect projects from costly cyber events that derail timelines and budgets.
-
Article 7 mins
Captives and Cyber: From Tactical Response to Strategic Risk Optimization
Captives are moving from a reactive stopgap to a core, strategic tool for managing cyber risk — helping organizations drive efficiency, manage volatility and build resilience in a rapidly evolving risk environment.
-
Article 23 mins
Q3 2025: Global Insurance Market Overview
Buyer-friendly conditions persisted in Q3, with ample capacity and intense competition driving continued price reductions and broader coverage for preferred risks, especially in property, cyber, and directors and officers.
-

Article 10 mins
Resilient Infrastructure: 3 Risks to Watch
Cost inflation, project complexity and tight schedules aren’t the only pressures facing infrastructure stakeholders. Emerging risks — from design and contract misalignment to tech-driven vulnerabilities — demand proactive risk management across the entire project lifecycle.
-

Article 9 mins
Breaking the Silence – Tailored Strategies for Men’s Mental and Financial Health
Conversations at work about mental health and finances can be daunting. That’s especially true for male employees, who fear the associated stigma. Employers can help those conversations by supporting a healthy culture and providing benefits designed to help with financial and mental wellbeing.
-
Article 41 mins
Country-Level Findings
Explore how risk perceptions vary across countries with insights from Aon’s 2025 Global Risk Management Survey.
-

Article 5 mins
Rethinking Talent Strategy as H1B Visa Costs Rise
As H1B visa costs surge, organizations face complex decisions in talent strategy and global workforce planning. This article explores how employers, talent, and industry must adapt holistically to remain resilient and competitive amid sweeping immigration and market changes.
-
Article 10 mins
Latin America’s Risk Landscape: Turning Complexity into Competitive Advantage
Latin American organizations face converging risks, but those who rethink resilience can unlock growth and gain a competitive edge.
-
Article 1 mins
Regional Results
Aon’s 2025 Global Risk Management Survey explores how organizations across four regions are responding to top risks—revealing both the challenges they face and the opportunities to build resilience in a fast-changing world.
-
Article 12 mins
Rethinking Resilience: Addressing Asia Pacific’s Top Risks
Asia Pacific’s risk landscape is shifting fast. Organizations that rethink resilience as a strategic differentiator will be best placed to navigate volatility and seize emerging opportunities.
-
Article 10 mins
Rethinking Resilience: Navigating North America’s Evolving Risk Landscape
North American organizations face intensifying risks across cyber, supply chain, reputation, and talent. Those who rethink resilience and risk management can turn uncertainty into a source of competitive advantage.
-
Article 10 mins
Turning Uncertainty into Opportunity: Managing Risk in the EMEA Region
In a region shaped by volatility and transformation, EMEA organizations are rethinking risk and resilience to unlock competitive advantage and navigate a rapidly evolving global landscape.
-
Article 10 mins
Where Cyber Meets Physical: Rethinking Risk in the AI Age
From drones that dodge surveillance to deepfakes that unlock doors, AI is reshaping physical security. It’s time for risk managers to rethink how they protect their organizations.
-

Article 7 mins
Optimizing and Personalizing Benefits with Artificial Intelligence
There are a few important ways AI is already influencing the health and benefit ecosystem in the U.S. Here’s how HR teams can harness their vendor ecosystem and use this technology to influence better health outcomes for their workforces.
-

Article 13 mins
Securing Power: Global Strategies for Data Center Energy Resilience
Artificial intelligence is driving unprecedented demand for data center power, straining global grid capacity and reshaping energy strategies. Developers are racing to secure reliable energy but face complex risks and challenges.
-
Article 11 mins
High Stakes in High Tech: Securing the Technology Supply Chain
As in-demand, high-value technology cargo travels through complex supply chains, any disruption can trigger costly delays and reputational damage. Leaders can manage volatility with a future-ready risk management approach backed by innovative insurance solutions and data-driven logistics.
-

Article 5 mins
2026 Salary Increase Planning Tips
Global voluntary turnover remains low, shaping cautious 2026 salary budgets and prompting a renewed focus on employee development to sustain engagement. Employers are balancing cost control with strategic investments in skills, paying high performers, pay equity and total rewards.
-
Article 8 mins
Adapting to Disruption: How Financial Institutions are Reframing Risk
Financial institutions are navigating a landscape of converging risks, from cyber threats and regulatory complexity to economic volatility and geopolitical disruption.
-
Article 9 mins
Building Resilience to Support Growth in Construction and Real Estate
Construction and real estate organizations are navigating a risk landscape shaped by economic volatility, digital acceleration and workforce disruption.
-
Article 1 mins
Industry Insights: Findings from Aon's Global Risk Management Survey
Business risks impact industries in different ways. Aon’s 2025 Global Risk Management Survey reveals how organizations across nine sectors are responding to today’s most pressing threats—from geopolitical volatility and cyber risk to supply chain disruption and talent shortages.
-
Article 10 mins
Managing Risk and Unlocking Opportunity in the Food, Agribusiness and Beverage Industry
Surging input costs, supply chain fragility and geopolitical instability are reshaping the risk landscape for the food, agribusiness and beverage (FAB) industry. As organizations face mounting pressure on margins and operations, leaders are rethinking risk strategies to unlock resilience and growth.
-
Article 11 mins
Navigating Risk in Insurance: Turning Complexity into Competitive Advantage
Aon’s Global Risk Management Survey shows insurers face a convergence of risks — cyber, climate and geopolitical volatility — that demand strategic resilience, sharper underwriting and innovation to stay relevant in a shifting landscape.
-
Article 10 mins
Navigating Risk in Life Sciences: Building Resilience to Support Growth
Faced with fragile supply chains, regulatory upheaval and rising competition, life sciences firms are reframing risk as a strategic enabler – using analytics and alternative capital to protect innovation and unlock growth.
-
Article 10 mins
Navigating Risk in Transportation and Logistics: Gearing Up for Big Transitions
As geopolitical instability, workforce disruption and rapid technological change converge, the transportation and logistics industry is undergoing a strategic transformation. Organizations are rethinking supply chains, investing in automation and reshaping workforce strategies to build resilience.
-
Article 11 mins
Navigating Volatility in Natural Resources: Risk Management as a Value Driver
From business interruption and commodity price volatility to shifting regulations and cyber threats, risks are converging to reshape the operating environment for the natural resources industry.
-
Article 9 mins
Technology, Media and Communications: Rethinking Risk in a Shifting Landscape
As disruption accelerates across the TMC industry, organizations face a complex web of risks — from cyber threats and AI upheaval to regulatory shifts and intensifying competition. Leaders are rethinking risk to build resilience, unlock growth and stay ahead in a rapidly evolving landscape.
-
Article 10 mins
Turning Risk into Resilience in the Industrials and Manufacturing Industry
From commodity price volatility and economic uncertainty to supply chain disruption and cyber threats, the industrials and manufacturing industry faces a convergence of risks that are reshaping the operating environment and requiring a new approach to risk.
-

Article 6 mins
Optimizing Your Property Program: A Risk Capital Approach to Manage Volatility
Risk buyers can build resilience in their property portfolios by implementing a risk capital strategy that utilizes alternative risk transfer sources to access capital and support long-term program stability.
-
Article 10 mins
Cyber and E&O: Pricing Holds, but Market Momentum is Shifting
The global cyber and tech errors and omissions market continues to favor buyers — for now. As AI-driven threats, privacy litigation and supply chain exposures intensify, forward-thinking organizations are using this window to build resilience.
-

Article 10 mins
A Better Approach to Succession Planning Using Assessment Data
Succession planning is evolving. By gathering comprehensive data and adopting predictive approaches, organizations can better anticipate workforce needs and build deeper benches of future leaders.
-
Article 7 mins
Business Interruption: Managing Risk in an Interconnected World
Business interruption is the second-highest global risk in 2025 — but is expected to fall to seventh place by 2028. As interconnected threats multiply, from cyber attacks to climate events, organizations must diversify supply chains, embed geopolitical insight and regularly update continuity plans.
-
Article 6 mins
Cash Flow and Liquidity Risk: A Rising Challenge
Cash flow and liquidity risk re-enters the top ten global risks in 2025 — and is expected to remain in tenth place by 2028. Amid an uncertain macroeconomic outlook, organizations must strengthen forecasting and unlock working capital to build financial resilience.
-
Article 7 mins
Commodity Price Risk and Material Scarcity: An Escalating and Complex Risk
Commodity price risk ranks sixth globally in 2025 — and is forecast to climb to fourth place by 2028. With supply chains strained by geopolitical tensions and climate disruption, organizations should consider hedging strategies, diversifying sourcing and exploring innovative risk transfer solutions.
-
Article 6 mins
Cyber Risk: Turning Uncertainty into Opportunity
Cyber risk tops the global risk agenda in 2025 — and is forecast to retain the number one position through to 2028. As digital threats evolve, organizations should strengthen resilience, quantify exposure and adapt their risk strategy.
-
Article 5 mins
Damage to Reputation or Brand: A Critical Risk
Damage to reputation or brand ranks eighth globally in 2025 — but is expected to fall to nineteenth by 2028. In an era of cyber threats, ESG scrutiny and social media amplification, organizations should quantify reputational risk and embed preventive measures into enterprise strategy.
-
Article 6 mins
Geopolitical Volatility: Preparing for the Unpredictable
Geopolitical volatility ranks ninth globally in 2025 — and is forecast to rise to fifth by 2028. With conflict, trade disruption and political instability on the rise, organizations must monitor global developments, regularly assess operational exposure and conduct scenario planning.
-
Article 5 mins
Increasing Competition Is Intensifying Risk for Organizations
Increasing competition ranks as the fifth biggest global risk in 2025 — and is projected to climb to number three by 2028. As technological disruption, talent scarcity and geopolitical shifts intensify market pressure, organizations must embrace agility, and rethink competitive strategy.
-
Article 8 mins
Navigating Regulatory and Legislative Change
Regulatory change ranks as the fourth biggest global risk in 2025 — and is expected to fall to sixth place by 2028. As policy shifts accelerate across sustainability, technology, trade and the workforce, organizations must adopt agile compliance strategies and unlock proactive risk management.
-
Article 9 mins
Supply Chain or Distribution Failure: Navigating the New Normal
Supply chain failure ranks seventh globally in 2025 — and is projected to fall to twelfth place by 2028. As weather-related disruption, geopolitical tension and cyber threats converge, organizations must balance efficiency with resilience and diversify sourcing.
-
Article 1 mins
Top 10 Global Risks
As risks increasingly overlap and evolve, managing them demands more than reactive strategies. This chapter explores the top-ranked risks from the survey and highlights how organizations that take a proactive, integrated approach can turn complexity into opportunity.
-
Article 6 mins
Why Economic Slowdown is an Ongoing Risk for Organizations
Economic slowdown ranks as the number three global risk in 2025 — and is projected to rise to number two by 2028. Amid trade tensions, inflation and geopolitical instability, organizations must strengthen liquidity, enhance workforce agility and rethink capital strategies to stay resilient.
-
Article 11 mins
In Conversation with Iberdrola: Navigating Megatrends
Spanish energy multinational, Iberdrola – a leader in grids, storage and clean energy – talks with Aon about its efforts to adapt and respond to climate impacts through its shift towards renewables and building a workforce for the future.
-

Article 6 mins
5 Bold Predictions for the Future of Total Rewards
Total rewards professionals must adapt quickly to changes in the workforce. Whether it's personalization of benefits powered by AI or a whole new language around total rewards, the near future may look very different than the status quo.
-

Article 10 mins
Rethinking Pay for Performance in the Era of Pay Transparency
As pay transparency regulations increase, companies must update their pay-for-performance strategies and ensure performance management and compensation are clear, fair and well-documented.
-

Article 17 mins
5 Data-Driven Ways HR Can Optimize Costs
Data and analytics can unlock value for HR professionals in a variety of ways. From a unified global benefits perspective to personalizing total rewards, gathering and analyzing the right types of data help companies optimize what can be their biggest expense.
-
Article 12 mins
People Risks Are Rising: Here’s How U.S. Benefits Are Stepping Up
Aon’s 2025 U.S. Health Survey shows how leading employers are responding to rising people risks by evolving their benefit strategies to address affordability gaps, legal pressures and rising employee expectations.
-

Article 13 mins
Aviation’s Future Flightpath: 5 Risks on the Horizon
Efficiency, safety and innovation are no longer enough in aviation. Leaders must now take decisive action to manage emerging risks and future-proof operations in a sector under intense scrutiny.
-

Article 10 mins
Sustainable Fuel in Transit: Overcoming Roadblocks to Adoption
The transportation industry is one of the highest emitters of greenhouse gases — and among the most primed for change — but the journey to decarbonize remains complex. Stakeholder collaboration will be critical in making sustainable fuel mainstream in aviation and marine.
-
Article 8 mins
Global Benefits During M&A: Turning Challenges into Opportunities
How pay and benefits are managed in M&A transactions creates a lasting impression on employees. Mismanagement can lead to disengagement and attrition, eroding deal value. But the challenge of integrating employee benefits can also bring opportunities to improve business outcomes.
-

Article 5 mins
Under Pressure: How Tax Insurance Supports Certainty in Cross-Border M&A
In a rapidly evolving tax environment, tax insurance is more than a safeguard — it’s strategic risk capital that unlocks value and accelerates deal confidence.
-
Article 5 mins
Rethinking Cyber Risk Capital in APAC: Closing Insurance Gaps
Despite unprecedented investment in digital transformation across Asia Pacific, there is a disconnect between cyber risk and capital allocation. Organizations are racing to innovate, yet the adoption of cyber risk capital trails behind the velocity of cyber threats.
-

Article 8 mins
The Role of D&O Insurance in Securities Class Actions: From Triggering Events to Claims Resolution
For public companies and their executives, facing a Securities Class Action (SCA) can be an overwhelming and unprecedented time. While the stakes are high, the procedural roadmap of an SCA typically follows a consistent trajectory.
-

Article 12 mins
Relevance Through the Market Cycle: 5 Strategic Imperatives for Insurers to Drive Performance
Relevance is not a phase — it’s a discipline. In a market defined by volatility, insurers must embed strategic relevance into every decision to outperform through the cycle.
-

Article 9 mins
Building Climate Resilience in Global Food, Agribusiness & Beverage
Climate change is now a central disruptor for FAB industries worldwide, impacting every tier, from raw production to global supply chains. Extreme weather, shifting rainfall patterns and regulatory changes are altering the landscape for every organization within the value chain.
-

Article 6 mins
Delivering Critical Cargo: Why Stock Throughput Insurance Matters to Life Sciences Leaders
Patient access to critical life sciences products is at risk when supply chains are disrupted. In a dynamic risk landscape, organizations are leveraging stock throughput insurance along with advanced risk strategies to ensure continuity, compliance and reputation.
-
Article 5 mins
Bridging the NIS2 Cyber Security Gap
Organizations must prioritize addressing critical cyber security vulnerabilities to comply with the EU’s NIS2 Directive and help bolster their resilience against cyber threats.
-
Article 7 mins
Why Pay Transparency Demands a Total Rewards Lens
Pay transparency is more than another regulatory mandate. It’s a foundational shift in how leading organizations are building resilient cultures and future-ready workforces — especially as scrutiny extends beyond base pay.
-

Article 22 mins
4 Strategies to Navigate Insurance Claims Trends
Dynamic trends are influencing the size and complexity of claims around the world. Proactive claims management can help organizations recover swiftly after a loss event and manage potential claims exposures.
-
Article 6 mins
Optimizing Your Property Program: How to Use a Soft Market to Build Resilience
While the global property insurance market currently favors buyers, it is uncertain how long this will last. Businesses should act now by adopting a proactive, data-driven property risk strategy that aligns financial stability and risk appetite with market dynamics.
-

Article 7 mins
Navigating the Regulatory and Investment Landscape for Non-Profits
Non-profit organizations in the U.S., Canada and the UK in particular, face unprecedented regulatory scrutiny and financial instability. Here are ways to strengthen investment strategies at a critical time using an OCIO model.
-
Article 10 mins
How Captive Insurance Supports the Energy Transition
The rapid growth of renewables demands innovative risk solutions. Captive insurance offers a strategic, flexible approach to managing evolving risks — helping energy leaders navigate volatility, optimize capital and unlock new opportunities in the transition to sustainable power.
-

Article 8 mins
An Insurer Roadmap for Navigating the Energy Transition
The energy landscape is rapidly changing, presenting the re/insurance industry a unique opportunity to facilitate the transition to a sustainable economic model.
-

Article 11 mins
De-Risking M&A in Financial Institutions: Strategies for Smarter Deals in Uncertain Markets
Against a backdrop of unsettled global markets, financial institutions can still capitalize on M&A opportunities by refining strategies and retaining focus on long-term ambitions.
-

Article 9 mins
Unlocking Mass Timber: Strategies for Risk and Insurance
Mass timber construction is gaining traction for its sustainability and efficiency, yet it brings distinct insurance and risk management challenges that require industry collaboration and proactive strategies.
-
Article 12 mins
Total Rewards Strategies That Drive Business Outcomes
As business demands grow more complex, employers must offer a total rewards package that balances the varied needs of the workforce with financial sustainability. Explore ways to ensure an effective total rewards program with data and timely communications.
-

Article 6 mins
Building Resilience for Another Active Atlantic Hurricane Season
Forecasters predict another above-average North Atlantic hurricane season. Businesses should use their saved premium dollars to strengthen their hurricane-prone properties and workforce, and treat risk management as a strategic asset.
-

Article 9 mins
How Risk Capital can Enhance Cargo Risk Management Amid Global Trade Challenges
The global marine cargo market faces many risks, ranging from shipping delays to geopolitical tensions. These challenges can be mitigated through a risk capital approach, which uses strategic capital allocation and data-driven insights.
-
Article 8 mins
Securing the Load: Strategies to Manage Complex Project Cargo Risks in the Construction Industry
Ensuring the safe delivery of construction materials along shifting trade channels is no simple endeavor. Learn how specialized insurance and risk management can support the transportation of construction cargo and help ensure project success.
-

Article 9 mins
Risk Capital Solutions in Life Sciences: How to Find Cost Efficiencies and Manage Volatility
Industry shifts and innovations are creating both new opportunities and challenges for life sciences organizations. Optimizing risk capital can enable business leaders to uncover cost efficiencies, strengthen resilience and enhance control.
-

Article 13 mins
Navigating Cargo Transportation Challenges in the Food, Agribusiness and Beverage Industry
The FAB industry faces significant supply chain challenges requiring innovative solutions and strategic planning. As organizations work to optimize capital and manage costs, they must also address geopolitical risks and regulatory updates.
-
Article 11 mins
Directors & Officers in the Digital Age: Managing New Technological Risks Across APAC
With rapid technological advancements, directors and officers face increasing liabilities. Proactive risk management and board oversight can ensure organizational resilience.
-
Article 10 mins
5 Ways to Position Risk Capital as a Value Driver
In today's uncertain economic climate, finance leaders must innovate beyond traditional financial metrics, managing risk capital through targeted risk strategies, holistic capital approaches and proactive stances toward emerging threats.
-
Article 6 mins
Taking a Data-Led Approach to Job Architecture to Accelerate Pay Transparency
With looming deadlines on pay transparency regulations, establishing an effective job architecture is foundational to compliance and preparation. We explore how a data-led approach can speed the process while maintaining objectivity.
-
Report 13 mins
Trade Issues Confront Global Businesses on Multiple Fronts
Global business leaders highlight risks linked to trade as some of their top concerns — both physical and financial. While the topic is complex and broad, there are opportunities that business leaders can pursue to stay ahead of emerging trade dynamics.
-

Article 5 mins
Parametric: A Complement to Traditional Property Coverage
As property underwriters become increasingly concerned and cautious with catastrophe-prone risks, buyers are turning to alternative property solutions, including parametric, to fill protection gaps in their programs.
-

Article 6 mins
3 Rules to Help Elevate Your Business Continuity Strategy
Half of the world’s top economic loss events impacted the U.S. in 2024. As natural catastrophes continue to grow in frequency and severity, enhancing a business continuity strategy helps ensure organizations are prepared for the unexpected.
-

Article 12 mins
A Targeted Strategy to Mitigate Rising U.S. Health Costs
While medical and pharmacy expenses continue to consume benefit budgets, employers can adopt effective cost-saving strategies that combine predictive analytics with innovative solutions to help control healthcare spend over a multi-year period.
-

Article 8 mins
Using Climate Data to Protect Employee Health
Employers are increasingly looking to defend the health and safety of their employees in a changing climate. By modeling the impact of weather on employees like they do for physical risks, employers can proactively establish solutions to protect workers.
-

Article 7 mins
Why Organizations Need a Robust Directors and Officers Risk Program
A variety of growing risks, including shareholder derivative actions, an evolving regulatory environment and bankruptcy filings, are why public and private organizations must protect their corporate directors and officers.
-
Article 15 mins
Navigating Cyber Risks in EMEA: Key Insights for 2025
Organizations in EMEA face unprecedented challenges as cyber threats become more sophisticated. In the face of emerging AI, evolving regulations and geopolitical tensions, businesses should strengthen their resilience to better navigate the complexities of the digital age.
-

Article 6 mins
Outsourced Chief Investment Officer: The Key to Navigating Volatility
In a volatile climate, institutional investors are turning to outsourced chief investment officers to conquer administrative, regulatory and market challenges.
-
Article 6 mins
Understanding the Financial Landscape of Wind Energy
Investment in both onshore and offshore wind power is key to not only energy security, but also wider social and economic benefits through the creation of jobs and investments in local communities around the world.
-
Article 8 mins
The CFO Roadmap: Expanding Success Beyond Financial Metrics
In today's intricate business environment, growth is expanding to include more than financial success. By understanding how to fund, shape and secure growth, organizations can build resilience and drive long-term value.
-
Article 6 mins
AI Innovations in Renewable Energy: Transforming the Sector
AI in the renewable energy sector is revolutionizing how we produce, manage and consume energy. As AI continues to evolve, industry leaders must find innovative ways to harness its full potential.
-
Article 8 mins
Cyber and E&O Market Conditions Remain Favorable Amid Emerging Global Risks
Despite higher claims frequency, the cyber and tech E&O markets remain in a favorable pricing and well-capitalized environment. However, buyers must remain vigilant and manage a variety of current and emerging cyber risks and threat actor attack methods.
-
Article 4 mins
5 Steps for Successful Carbon Accounting Verification
Organizations can demonstrate their commitment to global sustainability and a low-carbon future by addressing verification challenges and adopting best practices.
-

Article 15 mins
Management Liability Insurance Market in 2025: Stability Amid Evolving Risks
Market stability prevails in management liability lines as insurers continue to seek market share. However, expanding technologies, increased litigation and macroeconomic factors are causing growing uncertainty and underwriting concerns.
-
Article 7 mins
A Comprehensive Approach to Financial Wellbeing
There is an opportunity to develop a strategy around financial education in the workplace. Globally, our latest data finds 11 percent of employees receive financial education from their employer, but 37 percent expect it. How can employers bridge this gap?
-

Article 12 mins
Why Pay Equity Should Be Every Food, Agribusiness and Beverage Leader’s Priority
With growing global regulations and rising stakeholder and talent expectations, pay equity has shifted from a mere HR initiative to a top C-suite priority that goes beyond compliance.
-
Article 7 mins
How Technology is Transforming Open Enrollment in the U.S.
A well-structured open enrollment process is one that leverages innovative technology, encourages cost-effective use of healthcare resources and reduces unnecessary spending — benefiting both employees and employers.
-

Article 3 mins
Risk Analyzer Suite
Aon’s Risk Analyzer Suite delivers quantitative analytics, improved risk insights and supports operational efficiency.
-

Article 15 mins
2025 Life Sciences Outlook: Building Preparedness to Mitigate Risks and Capture Human Capital Opportunities
After a period of significant volatility, a more optimistic outlook is on the horizon for the life sciences industry in 2025. With the right level of preparedness, firms can take full advantage of the potential opportunities the new year will bring.
-
Article 6 mins
Decarbonizing Construction for a Low-Emission Future
Decarbonizing construction demands new materials and approaches, with a focus on managing risk and securing capital. By aligning sustainability with business strategy and risk management, the industry can meet net-zero targets.
-
Article 8 mins
Employer Strategies for Cancer Prevention and Treatment
Nearly 20 million people get cancer each year,<sup>1</sup> and the impact is far-reaching — from those diagnosed to their loved ones and colleagues. When developing a meaningful cancer prevention strategy, employers must show empathy and compassion while managing rising costs.
-
Alert 14 mins
L.A. Wildfires Highlight Urgent Need for Employee Support and Business Resilience
In the face of the L.A. wildfires, impacted businesses’ top priority is their people. A three-phased approach can help build business resilience and mitigate the effects of future events.
-
Article 23 mins
The AI Data Center Boom: Strategies for Sustainable Growth and Risk Management
Rapid growth in data center construction, spurred by AI advancements and cloud demand, creates interconnected risks for developers. However, with effective risk management solutions, navigating this dynamic market while prioritizing sustainability is possible.
-

Article 8 mins
Mitigating Volatility and Maximizing Profits: A Guide to Risk Capital in the Food, Agribusiness and Beverage Industry
In an industry with tight operating margins, FAB organizations face significant challenges in managing spend and protecting their financial health — requiring industry leaders to adopt a sophisticated approach to risk capital optimization.
-
Article 15 mins
5 Top Trends for Risk Capital in 2025
The risk capital landscape is poised for change, driven by emerging trends reshaping market dynamics. With a buyer-friendly market currently prevailing across most lines, opportunities abound for strategic investment and risk management.
-
Article 9 mins
3 Strategies to Help Avoid Workers Compensation Claims Litigation
When a workers compensation claim goes to litigation, expenses rise dramatically — a burden that is often shouldered by the business. To mitigate attorney-related costs, organizations should re-think their approach to engaging injured workers and use artificial intelligence to enhance outcomes.
-
Article 35 mins
5 Human Resources Trends to Watch in 2025
Human resources is increasingly involved in all areas of a company’s strategy. As the workforce changes, HR leaders should identify and leverage these five important and evolving trends.
-
Article 6 mins
The Long-Term Care Conundrum in the United States
Long-term care is expensive, and costs are rising due to shortages. With the population aging at the fastest rate in a century, finding solutions to pay for care is an urgent priority. How can employers support this growing population?
-
Article 7 mins
Improving Benefit Communication for a Multi-Generational U.S. Workforce
With a multi-generational and diverse workforce, it is important for employers to develop benefit communications and engagement strategies to help employees understand their unique benefit options. Here are five useful tips to consider.
-
Article 13 mins
Medical Rate Trends and Mitigation Strategies Across the Globe
Rising medical costs are a global phenomenon. Aon’s 2025 Global Medical Trend Rate Survey found that costs are projected to rise 10 percent in 2025.
-
Article 7 mins
Key Trends in U.S. Benefits for 2025 and Beyond
As healthcare costs continue to rise, employers are trying to balance the need to take care of their workers with the need to keep costs under control. Aon’s 2025 U.S. Health Survey provides insights into the choices employers are making, and their potential effects on costs.
-

Article 9 mins
Pension Reform: Navigating the Future of Retirement
Pension reforms in Europe are reshaping retirement planning, demanding more oversight from employers and new strategies for employees’ financial wellbeing.
-
Article 6 mins
Managing Non-Financial Risks to Build Organizational Resilience in the Financial Institutions Industry
Non-financial risks are often difficult to predict and quantify, yet present a real threat to financial institutions. In this volatile environment, risk management is playing a greater role in creating business resilience and identifying where capital should be deployed.
-
Article 9 mins
Ensuring Operational Stability Post-Spin-Off: A Conversation with Daniel Halter from Sandoz
Daniel Halter, Director Global Insurance at Sandoz, discusses how smart risk and insurance management supported the Sandoz core mission to provide affordable, off-patent medicines to patients who need them most with Ana Serdarevic, Head of Aon’s Transaction Advisory Services for DACH.
-
Article 7 mins
How to Navigate AI-Driven Cyber Risks
Business leaders are aware of AI-driven cyber risks and their implications. But understanding changing risk profiles to make better decisions around the management of new exposures is the key to cyber resilience.
-

Article 8 mins
U.S. Rail Sectors Work to Mitigate Capacity and Pricing Risk Issues
U.S. freight and commuter rail industries are facing excess liability and property issues for different reasons. These railroads are critical to infrastructure and vital to the economy, yet finding effective solutions remains complex.
-
Article 11 mins
D&O Risks and Considerations for Businesses Planning an IPO
As private companies prepare for an IPO, they face increased risks that require directors and key leaders to adopt essential risk management strategies to ensure a smooth transition.
-
Article 10 mins
How Public Entities and Businesses Can Use Parametric for Emergency Funding
As climate change intensifies the frequency and severity of extreme weather events, public entities and businesses need more flexible funding solutions. Parametric stands out as an adaptable resource capable of swiftly responding to potential disasters.
-

Article 17 mins
How Insurance Helps Unlock Capital for Hydrogen Projects Amid Financing Pressures
Funding challenges due to macroeconomic factors have prevented several green and blue hydrogen projects from getting off the ground. Organizations facing hurdles in accessing capital can work with risk and insurance experts to expedite projects and help make the promise of hydrogen a reality.
-

Article 11 mins
Strengthening Human Capital Strategies to Attract Talent in the Food, Agribusiness and Beverage Industry
Learn how strong human capital strategies can help recruit, retain and motivate vital talent in a competitive and evolving job market.
-

Article 7 mins
Trends U.S. Corporate Boards Should Prepare for in 2025
As corporate boards meet to discuss strategy, including any changes to executive compensation, there are key trends to consider for the year ahead.
-

Article 6 mins
Leading the Biofuels Transition: Risk Strategies to Cut Through Complexity
Companies aiming to be a net-zero company may face many challenges during the biofuels transition. Read more on risk strategies to cut through complexity.
-

Article 6 mins
DC Pension Schemes: Improving Investment Returns
With DC schemes growing across Europe, many organizations are realizing the importance of ensuring strong performance from their investments. Here’s how asset owners and managers can optimize DC outcomes through the right investment strategy.
-
Article 9 mins
Developing a Paid Leave Strategy That Supports Workers and Their Families
With no federal paid leave law in the U.S., employers have limited guidance in designing equitable and comprehensive paid leave programs to support their workforce. Looking beyond compliance to focus on strategy and values will help create fair and well-designed policies.
-
Article 8 mins
2025 Salary Increase Planning Tips
Amid economic uncertainty, companies are taking a careful approach to hiring and salary planning — one that includes focused hiring strategies, revising salary budgets and implementing measures that respond to the current economic environment.
-
Article 8 mins
Florida Hurricanes Not Expected to Adversely Affect Property Market
Hurricanes Helene and Milton insured loss estimates are expected to fall between $34 billion and $54 billion. Healthy, well-capitalized insurance and reinsurance markets are positioned to absorb those losses.
-
Article 17 mins
Q3 2024: Global Insurance Market Overview
Buyer-friendly conditions continued across much of the global insurance market in Q3, painting a largely positive picture as we head into year-end renewals.
-
Article 10 mins
Why It’s Key to Conduct Cyber Due Diligence in Financial Services During Mergers and Acquisitions
A successful M&A strategy relies on due diligence across financial, legal, human capital, technology, cyber security and intellectual property risks. As cyber threats become more complex, robust cyber due diligence in private equity and acquisitions is increasingly necessary.
-
Article 8 mins
The Evolving Threat of Cargo Theft: 5 Key Mitigation Strategies
Cargo theft in the transportation industry is escalating, driven by sophisticated criminal tactics that exploit both physical and digital vulnerabilities. Businesses must adopt proactive risk management strategies to counter these evolving threats.
-
Article 11 mins
4 Megatrends Affecting Middle Market Organizations in North America
Trade, technology, weather and the workforce are interconnected trends shaping the future of business in North America. Understanding them is key to long-term resilience.
-
Article 9 mins
Building Resilience in a Buyer-Friendly Cyber and E&O Market
Competition and capacity are dominating the cyber liability market and pricing remains favorable as a result. Taking advantage of the current buyer’s market to build sustained cyber resilience is the key to success.
-
Article 10 mins
How Risk Transfer Solutions Increase Capital Access in Renewable Energy M&A Deals
The growing renewable energy sector is boosting M&A activity. Risk transfer solutions can help unlock capital access in these transactions.
-

Article 7 mins
Managing Human Capital to Drive Innovation in Life Sciences
Digitalization presents both opportunities and challenges in life sciences, driving new organizational approaches to human capital to keep up with evolving talent needs while building a resilient workforce.
-
Article 5 mins
Connected Perspectives: Better Decisions on Digitalization for Financial Institutions
As financial institutions reshape human capital strategies for the digital age, leaders face pressure to balance the risks and opportunities of digitalization.
-
Article 9 mins
The Next Evolution of Wellbeing is About Performance
Employers are concerned that previous wellbeing strategies aren’t moving the needle enough. But when wellbeing is part of an organization’s culture, it has positive effects on costs, engagement and productivity.
-
Article 6 mins
How Human Capital Data Enhances Risk Management for Financial Institutions
Financial institutions can increase their resilience to volatile threats through enhanced risk management frameworks and innovative models powered by people data and technology.
-
Article 10 mins
How Financial Institutions can Prepare for Pay Transparency Legislation
As the deadline for implementing the EU Pay Transparency Directive fast approaches, some financial institutions feel unprepared to comply. These five steps can help guide the way through the upcoming regulatory landscape.
-
Article 9 mins
4 Ways to Foster a Thriving Workforce Amid Rising Health Costs
Thriving organizations rely on thriving employees to succeed. With healthcare costs on the rise, it’s time for employers to challenge the status quo in providing health benefits. Organizations need to consider the human side of these increases and take bold action to achieve better outcomes.
-

Article 9 mins
How Social Inflation is Impacting the Aviation Industry
The aviation industry is watching the rise in nuclear verdicts with concern as social inflation and associated risks continue to squeeze the sector. Organizations should review their risk management processes to limit the dollar value of future losses.
-
Article 12 mins
Navigating AI-Related Risks: A Guide for Directors and Officers
As AI evolves, directors and officers must maneuver through a complex landscape of regulatory and legal risks. Implementing best practices around the use of AI and robust governance-focused risk mitigation can help manage exposures.
-
Article 11 mins
A Middle Market Roadmap for Cyber Resilience
Middle market organizations face unique challenges in the ever-changing cyber environment, requiring holistic insurance solutions and enhanced resilience readiness to manage risks that could impact profitability.
-
Article 17 mins
3 Strategies to Improve Career Outcomes for Older Employees
With life expectancies and retirement ages on the rise, organizations can capitalize on the value that older employees offer and support them by fostering a workplace where both the business and its people thrive.
-

Article 8 mins
Wildfire Risk Fuels New Challenges for U.S. Communities
As climate change compounds wildfire risk, organizations play a critical role in protecting their workforce before and after an event.
-

Article 10 mins
5 Ways to Address Health and Wellbeing in the Transportation Industry
The transportation and logistics industry faces unique challenges which can negatively impact employees' health. A cultural shift to more tailored wellbeing strategies can improve health outcomes and boost company performance.
-
Article 20 mins
5 Ways HR Can Partner with Finance to Drive Growth
The role of HR professionals is becoming more strategic, which requires collaboration with other areas of an organization to help drive growth. Given that people and benefit costs are a large portion of business expenses, partnering with finance is a natural step forward.
-

Article 5 mins
Remote Work and Potential Employment Practices Liability Perils
Aon analyzes employee perception about return to office policies following the COVID-19 pandemic, as well as recent actions one organization took for alleged lack of remote employee productivity.
-
Article 11 mins
The Silver Lining on M&A Deal Clouds: M&A Insurance Insights from 2023
Despite subdued global M&A in 2023, positive trends have been emerging in the M&A insurance market to help clients improve their deal-making and ‘value-protection on investment’.
-

Article 7 mins
Specialist Insights: A Deep Dive into Effective Crisis Management and Evacuation Protocols
Graeme Hudson and Ghonche Alavi from Crisis24 discuss Crisis24’s approach to Political Evacuation and Threat Management with Cara LaTorre from the Financial Services Group at Aon.
-

Article 8 mins
3 Human Capital Recommendations for Construction Contractors Entering Asia
European construction contractors are looking with increasing interest at Asia, but to expand successfully into the region, they need to overcome key workforce and market challenges.
-
Article 8 mins
How Cyber and Data Resilience Support Growth in Life Sciences
As digitalization presents new risks and opportunities for life sciences organizations, implementing cyber and data resilience ensures that innovation doesn’t result in business interruption.
-
Article 7 mins
How Insurance Companies can Sustain Profitable Growth Through the Market Cycle
For insurers, making decisions on where and how to deploy capital becomes more difficult during times of volatility.
-

Article 5 mins
Key Considerations When Exploring Captives for Voluntary Employee Benefits
Employers in the U.S. should understand the unique risks associated with voluntary benefit captives when considering alternative insurance arrangements for their voluntary benefit plans.
-

Article 7 mins
Improve Safety and Loss Control to Lower Workers Compensation Costs
Workers compensation is an area of risk management that could benefit from a more holistic approach. A safety program that incorporates wellbeing and uses data in a meaningful way can contribute greatly to lowering costs.
-
Article 8 mins
How Aon Partnered with Minnesota Firefighters to Create Crucial Health Benefits
Firefighters face a unique set of risks and long-term health consequences from their jobs. Aon worked with Minnesota firefighters to create a benefit program to address three primary health issues.
-
Article 8 mins
4 Steps to Help Mitigate the Cost of Open Workers Compensation Claims
Open legacy workers compensation claims place rising financial burdens on employers, who are faced with closing out aged claim inventory and improving their balance sheets in the process.
-
Article 5 mins
Climate Change: Evolving Property Risk to Resilience
Organizations must consider the impact of climate change on property, which will vary now and years into the future. Therefore, a thoughtful approach can enhance risk mitigation and resilience strategies.
-

Article 8 mins
Middle Market Risk, Regulatory and Compliance Strategies
Helping midsize organizations strike the right balance between risk and compliance with a comprehensive regulatory and compliance framework.
-

Article 5 mins
Empowering Employees to Make Better Health Plan Decisions
As U.S. employers balance costs with providing employees more value from their benefits, creating an annual healthcare enrollment process that includes more choice and guidance can accomplish both goals.
-
Article 10 mins
Q2 2024: Global Insurance Market Overview
With many insurers reporting healthy profits in 2023, and in response to notable improvements in the reinsurance market, the insurance market in Q2 2024 remained growth-oriented.
-
Alert 3 mins
Better Decisions Brief: Perspectives on the CrowdStrike Outage
On July 19, 2024, the CrowdStrike outage became one of the largest IT events in history, impacting businesses and customers around the world. Leaders now have an opportunity to reexamine technology dependencies and business continuity plans to mitigate similar risks in future.
-

Article 6 mins
How Insurers are Integrating Climate Change into their Investment Decisions
Insurers are some of the world’s largest institutional investors. Recognising their crucial role in driving the global climate transition, they should identify and analyse climate-related risks and opportunities to improve long-term risk-adjusted returns.
-
Article 7 mins
Lessons Learned from the CrowdStrike Outage: 5 Strategies to Build Cyber Resilience
The global CrowdStrike IT outage demonstrated that even non-malicious cyber incidents may have serious repercussions. Events like these serve as a wake-up call for businesses to review their cyber resilience and be prepared for more significant incidents in the future.
-
Article 4 mins
Companies Need a Global Benefits Identity in an Era of Cost Containment
More global benefits professionals are aligning benefit strategy to an employer’s identity and values.
-

Alert 10 mins
Responding to the CrowdStrike Outage: Implications for Cyber (Re)Insurance
CrowdStrike, a global cybersecurity firm, released an update for its Falcon sensor, which caused system crashes on Microsoft Windows systems globally.
-
Article 8 mins
Responding to Cyber Attacks: How Directors and Officers and Cyber Policies Differ
Cyber incidents continue to grow in frequency and severity, especially as new technology emerges. While D&O and cyber liability policies offer distinct coverage differences, terms need to be carefully structured to avoid potential gaps.
-

Article 6 mins
Insurance and the Metaverse: Safeguarding Virtual Assets
Insurers are venturing into the thriving digital landscape of the Metaverse, covering virtual assets, safeguarding intellectual property, and protecting the wellbeing of users and avatars. With this evolution, comes new challenges and the unique opportunity to shape the future of insurance.
-
Article 10 mins
Build Resilience for an Extremely Active Atlantic Hurricane Season
Record-warm Atlantic Ocean temperatures and a shift to La Niña conditions have led forecasters to predict an extremely active Atlantic hurricane season in 2024. Learn how to build business resilience to mitigate risk for hurricane-prone properties.
-
Alert 7 mins
Workforce Implications of U.S. Supreme Court Ruling on ‘Chevron Deference’
The U.S. Supreme Court has changed the way laws are interpreted in the development of regulations. This change has the potential for far-reaching consequences for both regulatory agencies and employers.
-

Article 4 mins
Credit Solutions Market Overview
Overview of the current trade credit insurance market and outlook on trend developments.
-

Article 11 mins
Building a Future-Ready Workforce for the Professional Services Industry
The need to attract and retain high-quality talent in an environment of intense competition is at the forefront of professional services leaders’ minds.
-
Article 11 mins
Enhancing Cyber Resilience in the Renewables Sector
Renewable energy is critical to meet net-zero targets, but as the industry grows, so do cyber attack surfaces. Learn how to prepare for emerging threats and support long-term ambitions.
-

Article 7 mins
Connected Perspectives: Better Decisions on Interconnected Risks for FAB Organizations
As the scale and speed of interconnected risks escalate, innovative risk management strategies help FAB businesses build the resilience and agility needed to thrive.
-

Article 10 mins
Driving a Future-Proof, Skills Based Approach for the Renewable Energy Sector
The renewable energy sector is undergoing a sweeping transformation, as it plays a pivotal role in the challenge to achieve global net-zero goals. Attracting, upskilling and retaining talent is critical for sustainability.
-
Article 7 mins
How to Navigate Evolving Construction Contractor Risks in EMEA
Contractors in EMEA face an array of risks they must mitigate or transfer while managing the complexities inherent in major construction projects.
-

Article 12 mins
8 Focus Areas for the Renewable Energy Sector
As more companies seek to reduce their carbon footprint, the renewable energy sector continues to grow, presenting both opportunities and red flags for organizations with renewable energy growth plans.
-

Article 6 mins
Reshoring: Managing Risks and Building Resilience Closer to Home
Proactive risk management and data-driven reshoring strategies can empower risk managers in logistics companies to navigate supply chain complexities with confidence.
-
Article 5 mins
Captive Insurance: Uptick in Use Reflects Market Realities
As more companies become comfortable using captives and understanding the value they add, captives are likely to become further embedded into corporate risk strategies, regardless of market conditions.
-

Article 6 mins
Building Strategies for Sustainable Growth as a Mid-Sized Organization
Helping midsize organizations leverage key partnerships to address challenges around talent, market, regulatory compliance, and leveraging capital.
-
Article 12 mins
Helping Employers Navigate the Rise in High-Cost Medical Claims
A rapid rise in medical plan costs is being driven in part by high-cost claimants — a high-risk group that disproportionately accounts for a large amount of healthcare costs. Here are strategies for addressing this issue.
-
Article 9 mins
Four Steps to Implementing an Effective Online Benefits Platform
Online benefits platforms are a key component of the overall employee value proposition. As employers maximize the ROI of their people spend, here are four tips which may assist with implementing a successful online benefits platform.
-
Article 8 mins
Pay Transparency Can Lead to Better Equity Across Benefits
Efforts to bring more transparency to pay practices shine a light on benefits equity — and it’s not only about wages and salary.
-

Article 3 mins
Building Resilience Against the Constant Cyber Threat
The rapid pace of digitalisation means that organisations in the UK are constantly struggling with the ever-present threat of cyber attacks.
-

Article 2 mins
Creating a Fair and Equitable Workforce for Everyone
Equity has an important part to play in a balanced strategy to improve the attraction and retention of key employees.
-

Article 2 mins
How to Balance the Conflicting Forces of Efficiency, Performance and Wellbeing
How are business leaders adapting to a generational change in how work gets done?
-

Article 2 mins
Introduction: Clarity and Confidence to Make Better Decisions
Lori Goltermann, CEO of Regions and Enterprise Clients, Aon examines the main issues discussed at the event.
-

Article 2 mins
Making Better Decisions – A Treasurer’s Perspective
Our panel discussion looked at the issues facing corporate treasurers and how they have become more complex and interconnected.
-

Article 3 mins
Seizing the Opportunity: Building a Comprehensive Approach to Risk Transfer
Businesses are still in search of competition, alternatives and innovation in their insurance programmes.
-
Article 2 mins
Tapping New Markets to Unlock Deal Value
Companies and financial sponsors are constantly seeking innovative and capital-efficient ways to facilitate M&A deals.
-

Article 2 mins
The Age of Rising Resilience – An Economic Outlook
Professor Trevor Williams analyses the latest indicators and what they mean for the UK — and global — economy.
-

Article 2 mins
The Aon Difference
How Aon is moving further, faster to bring new, innovative solutions that address companies’ risk and people challenges.
-

Article 5 mins
The Rise of the Skills-Based Organisation
Today's employers need to continually learn and adapt to emerging technologies and skills if they are to thrive in the talent landscape.
-
Article 6 mins
Three Ways Collective Retirement Plans Support HR Priorities
Collective retirement plans are growing in popularity and improving employees’ financial wellbeing in the process. Other advantages that haven’t been as widely explored include how these retirement structures allow HR to shift its focus to strategy.
-
Article 8 mins
How North American Construction Contractors Can Mitigate Emerging Risks
Getting ahead of risk is vital for North American construction contractors, as they aim to manage evolving issues, while delivering job safety, solving workforce shortages and containing project costs.
-

Alert 6 mins
U.S. Department of Labor Restores and Extends Overtime Protections
The Department of Labor released a final rule increasing overtime protections for the standard salary level threshold for the “white collar" exemptions and the threshold for employees classified as Highly Compensated Employees. Employers need to prepare for these significant changes.
-
Article 10 mins
How Insurers Can Capture Climate Opportunities
Climate change adaptation and the transition to net zero present huge premium growth opportunities for insurers. The key question is how to get started.
-

Article 7 mins
How to Navigate the EMEA Cyber Risk Insurance Market
As the cyber insurance landscape continues to evolve in EMEA, companies need actionable insights and solutions to strengthen their cyber risk strategies.
-
Article 9 mins
Insurers Seek Risk Transfer Solutions to Offset Higher Retentions and Resume Growth
The challenges of 2023 eroded the buffers that many insurers had previously enjoyed, bringing an increased focus on capital management and a variety of capital sources according to Aon’s capital poll.
-

Article 6 mins
How to Make the Most of Voluntary Benefit Plans in the U.S.
As healthcare costs rise, voluntary benefits are a critical component of engaging employees, while also helping to manage direct and indirect medical expenses. Here are three strategies for employers to make the most of their voluntary benefits.
-

Article 8 mins
NIS2 Compliance Readiness for Organizations across the European Union
The expansive scope, stringent sanctions and pivotal role of management related to the new NIS2 Directive provide a strong foundation to protect against evolving cyber risks.
-

Article 8 mins
London Insurance Market: Unveiling Demands for New Skills in 2024
The London insurance market seeks a generation of game-changers who can navigate uncertainties and drive innovation to ensure the industry’s future success in a digitalised world.
-
Article 15 mins
How Artificial Intelligence is Transforming Human Resources and the Workforce
Artificial intelligence is having a measurable impact across all aspects of HR — from talent management to compensation, health and benefits, and retirement planning. To effectively harness the technology, HR leaders must ensure both their own teams and the wider workforce are prepared.
-

Article 8 mins
Energy Transition Investments: How Advanced Analytics Can Empower Organizations
Advanced analytics can empower organizations with deeper insights into the risks and opportunities surrounding renewables, while also supporting energy transition investment.
-
Article 17 mins
Q1 2024: Global Insurance Market Overview
Positive performance in 2023 fueled insurer growth ambitions but underwriting remained disciplined in the first quarter of 2024.
-
Article 12 mins
How Life Sciences Build Robust Talent Pipelines in the Age of Digitalization
While digitalization is delivering transformational change to R&D across the sector, it is also rapidly reshaping recruitment and retention strategies.
-

Alert 6 mins
U.S. Federal Trade Commission Bans Employee Noncompete Agreements; Here’s What Employers Should Know
The FTC has announced a rule that bans noncompetes and clauses that have a similar effect. While the rule will face legal challenges, employers should take steps now to prepare for an environment where they cannot use noncompete agreements.
-
Article 7 mins
Managing Construction Risks: 7 Risk Advisory Steps
Risk advisory services can help construction stakeholders navigate uncertainties, optimize performance and drive growth in their projects.
-

Article 9 mins
Floating Offshore Wind Unlocks New Opportunities and Challenges
While there are similarities in the risk profile of floating offshore wind and bottom-fixed offshore wind, challenges like unproven technology and tow-to-port strategies for maintenance require a collaborative approach between owners/developers and their insurance partners.
-
Article 4 mins
Parametrics Unlock Solutions For Future Risks
Macrotrends are transforming our world and creating emerging property-casualty exposures, which will have profound implications for the insurance industry.
-

Article 7 mins
U.S. Cyber Insurance: Market Trends and Opportunities
Understanding market trends and future projections in an evolving cyber insurance market is paramount to strengthening risk mitigation and transfer strategies.
-
Article 5 mins
How Climate Modeling Can Mitigate Risks and Improve Resilience in the Construction Industry
In an era of escalating climate-related challenges, the construction industry is turning to advanced climate modeling to fortify its risk management strategies.
-
Article 14 mins
How Technology Will Transform Employee Benefits in the Next Five Years
Advances in technology will not only transform healthcare and treatment outcomes — benefit offerings, access to care, diagnosis, treatment and affordability challenges will also be radically changed. Here is what to expect as these efforts take shape globally.
-
Article 10 mins
Key Trends in U.S. Benefits for 2024 and Beyond
As healthcare costs continue to rise, employers are struggling to balance cost control with attracting and retaining talent. The results of Aon's 2024 U.S. Health Survey point to key strategies organizations are using to help.
-

Article 11 mins
Capturing Carbon on the Critical Pathway to Net Zero
As the world races to reduce climate risks and limit CO<sub>2</sub> emissions, the demand for scalable and cost-effective decarbonization technologies is increasing. Carbon capture projects form an important part of the low carbon energy transition, bringing both challenges and opportunities.
-
Article 7 mins
Protecting North American Contractors from Extreme Heat Risks with Parametric
Growing extreme heat conditions have escalated risks, delays and costs for the construction industry in North America. Parametric insurance can help protect against such risks, offering contractors and building owners agility, efficiency and flexibility.
-

Article 9 mins
How Insurance Can Help Hedge Potential Exposures Under the New Unified Patent Court System
The launch of the Unified Patent Court allows for a new patent filing process across Europe using a centralized system. While this brings significant financial and operational benefits, navigating these changes will demand a robust litigation risk management strategy.
-
Article 8 mins
Parametric Can Help Mitigate Extreme Heat Risks for Contractors in EMEA
Construction projects in EMEA are often impacted by extreme heat, leading to project delays and increased costs. Many heat exposures are excluded by traditional markets, however, parametric is a flexible solution that can help mitigate these risks.
-
Article 12 mins
Understanding and Preparing for the Rise in Pay Transparency
New regulations in the U.S. and Europe will require companies to be more transparent about their pay practices. Combined with willingness among workers to talk about salary, the era of pay transparency is here.
-
Article 11 mins
Advancing Women’s Health and Equity Through Benefits and Support
As companies tailor their health and benefits to meet the needs of their employees, vital areas for support include family building and menopause.
-
Article 7 mins
Unlocking Capacity and Capital in a Challenging Construction Risk Market
Complex market dynamics in the construction industry are pushing organizations to proactively explore alternative risk transfer solutions, including parametric insurance and captives.
-
Article 11 mins
Securing Human Capital in Natural Resources
As new job roles and technologies emerge in the natural resources industry, employee expectations are also shifting. Leaders must rise to the challenge of securing talent to meet the world’s future energy needs.
-

Article 5 mins
Navigating Cybersecurity Risk Under New U.S. Rules
Rulemaking from the Securities and Exchange Commission (SEC) highlights the importance of company transparency with investors and regulators around risk management and the impact of cyber events.
-
Article 13 mins
Building Growth From Uncertainty in Financial Institutions
Five ways financial institutions can balance investment with prudence in an uncertain economic climate.
-
Article 12 mins
Q4 2023: Global Insurance Market Overview
An increasingly interconnected and complex risk landscape continues to shape risk strategies and market responses.
-
Article 13 mins
Top Risk Trends to Watch in 2024
To be successful, business leaders must keep pace with the key trends that will impact the risk and insurance landscape in 2024.
-
Article 9 mins
How to Navigate Contractor Shortages in the Energy and Power Industries
Taking a new approach to talent management and planning for worker shortages can help businesses in the energy and power industries build greater operational resilience.
-
Article 11 mins
How Investors are Making Better Decisions Amid a Changing Climate
For investors, climate change means navigating uncertainties and understanding a wide range of potential outcomes.
-
Article 5 mins
Understanding Freeze Risk in a Changing Climate
Extreme cold and freeze were responsible for $15 billion worth of structural damage in recent years, as well as business interruption and supply chain impacts. We explore the threat chronic hazards pose and consider the influence of climate change on business.
-
Article 7 mins
4 Steps to Help Take Advantage of a Buyer-Friendly Directors' & Officers' Market
The global D&O market remains soft, creating a favorable environment for buyers. With abundant capacity and increased competition, capitalizing on conditions now is critical as rates are showing signs of moderating.
-
Article 15 mins
Five Big Human Resources Trends to Watch in 2024
It's never been more important for HR leaders to help shape and support the execution of business strategies. However, to be successful in today’s volatile world, HR teams must stand ready to understand and harness five fast moving trends.
-
Article 8 mins
Managing Reputational Risks in Global Supply Chains
Supply chain disruptions can have serious reputational repercussions, causing plummeting shareholder value and diminished stakeholder trust. The potential fallout underscores the need for management strategies that collectively address these risks.
-

Article 7 mins
Creating Operational Resilience Amid Growing Risks in the Food, Agribusiness and Beverage Industry
To feed a growing global population, FAB organizations must build operational resilience to overcome supply chain, cyber, geopolitical and climate risks.
-
Article 7 mins
Seizing Opportunity in a Booming Pension Risk Transfer Market
Businesses considering pension risk transfer to mitigate volatility should prepare now to be well-positioned for market opportunities.
-

Article 7 mins
How Collective Retirement Plans Help Support Financial Sustainability
Improving retirement plan governance is crucial during economic uncertainty. Collective retirement plans, like a pooled employer plan, reduce risk and streamline administrative expenses for employers while also boosting employee support.
-

Article 4 mins
Addressing Risks is Critical in a Deal-Hungry M&A Market
Senior executives aren’t letting a tough market for transactions stop them from finding new approaches to closing deals.
-
Article 8 mins
Improving Agricultural Practices to Address Climate Risks
Good agricultural practices reduce emissions, expand carbon sequestration and benefit the supply chain from the very first mile — all key components of achieving future climate goals.
-

Article 3 mins
Parametric Solutions: Rethinking Resiliency Educational Video Series
Hear from Aon and industry thought leaders to increase your working knowledge of Parametric Solutions through our four-part educational video series.
-

Article 5 mins
Six Key Considerations for Supporting Employee Wellbeing
By taking a 360 view of employee wellbeing, leaders can build the resilience of their organizations while improving workplace experiences.
-
Article 6 mins
Using Parametric Insurance to Close the Earthquake Protection Gap
Parametric solutions have the flexibility to make hard-to-predict and often uninsurable “grey swan” events insurable. Such is the case for earthquakes — a potentially catastrophic risk across the globe.
-
Article 9 mins
Insurance Plays a Key Role in Transitioning to a Low Carbon Future
The insurance industry can help the economy transition to alternative energy sources and mitigate the impacts of climate change — from facilitating capital for clean technologies to protecting people and businesses.
-
Article 6 mins
Why Now is the Right Time to Customize Cyber and E&O Contracts
The non-standardized nature of cyber and E&O policy wording creates the opportunity to mold an individually tailored and responsive risk transfer tool.
-
Article 5 mins
How Technology Enhancements are Boosting Parametric
As data becomes more advanced and precise, so does parametric insurance as a risk solution — a win-win for both risk managers and insurers.
-

Article 7 mins
The Trends Driving Global Pension Risk
The landscape for U.S. and UK pension plans has changed greatly. Companies are mitigating risks to meet regulatory requirements and protect their employees and finances.
-
Article 6 mins
Tips for 2024 Salary Increase Planning
As hiring and employee turnover slows down, employers have an opportunity to rethink their salary increase strategy for 2024.
-

Article 7 mins
Building Workforce Resilience in the Fashion and Luxury Goods Industry
With more brands looking to reposition themselves in the fashion and luxury industry and secure their future, a robust workforce resilience strategy will be key.
-
Article 5 mins
Intellectual Property Insurance: Dispelling the Myths and Misconceptions
In a landscape where IP is increasingly becoming integral to company valuations, many business leaders, boards, patent attorneys and litigation teams are making IP insurance a key asset in their toolkits.
-
Article 12 mins
The Conditions Driving the Rising Global Medical Trend Rate
Medical costs continue to rise around the world. Aon’s Global Medical Trend Rate report provides insight into what conditions are driving these increases.
-

Article 7 mins
Now is the Time for CEOs to be Bold on Talent
Insurance CEOs are well aware of the talent crisis: they’re fully engaged and seeking answers.
-

Article 11 mins
A Surge in Gene and Cell Therapies Raises Financing Questions
Gene and cell therapies represent breakthrough advances in medicine, but they also have significant costs and potential risks for patients, employers, insurers, governments and manufacturers.
-

Article 11 mins
Understanding Extreme Heat: An Increasing Risk for People, Businesses and Society
In the wake of record-breaking high global temperatures in 2023, the rising frequency of extreme heat due to climate change creates an urgency for the risk industry to analyze climate trends for better risk mitigation.
-
Article 18 mins
5 Ways Artificial Intelligence can Boost Claims Management
(Re)insurers must embrace AI technology to successfully navigate today’s emerging transformative trends that are shaping the insurance landscape.
-

Article 4 mins
Climate Change: Plugging the Growing Risk Gap in the Technology, Media and Communications Industry
Technology, media and communications businesses need to understand how climate change threatens their operational resilience. Parametric insurance is becoming an important part of the solution.
-

Article 8 mins
How to Build a Talent Strategy for the Future
Creating the right mix of talent will be key for capturing (re)insurance growth opportunities as transformative trends shape the future landscape.
-

Article 11 mins
Risk Factors Driving the Global Average Medical Trend Rate
With medical costs continuing to rise globally, Aon’s 2024 Global Medical Trend Rates Report examines the risk factors driving the increased costs.
-
Article 6 mins
To Disclose Pay or Not? How Companies are Approaching the Pay Transparency Movement
New pay transparency laws are forcing employers to develop a pay disclosure strategy and make decisions like whether to voluntarily disclose salaries where it’s not legally required.
-
Article 9 mins
Driving Private Equity Value Creation Through Credit Solutions
The strategic use of credit solutions (credit insurance, political risk insurance and surety) can enhance liquidity, improve transaction returns, facilitate capital-efficient deal closures, and support long-term value creation.
-
Article 9 mins
How the Right Employee Wellbeing Strategy Impacts Microstress and Burnout at Work
Burnout and languishing threaten individual and organizational productivity and business outcomes. A company’s employee wellbeing strategy can help prevent them by mitigating microstress.
-
Article 4 mins
Navigating Climate Risk Using Multiple Models and Data Sets
A holistic understanding of climate risks requires a multidimensional approach to data, risk models and developing staff expertise.
-

Article 7 mins
Designing Pension Communications for Modern Retirement Planning
Organizations can refresh their employee pension communications with these five tips to help people connect with their retirement planning.
-
Article 6 mins
Pricing Technology for Insurers: Avoiding Pricing Pitfalls
Pricing pitfalls are more common than you think, whether it's working with incomplete data or key man risk – but with the right pricing process, many of these issues can be mitigated. Read our article to learn about the most common pricing errors, and what insurers can do about it.
-

Article 5 mins
Pricing Technology for Insurers: The Importance of Getting Pricing Right
In today's increasingly complex insurance landscape, an inadequate pricing system can not only impact insurers' view of risk, but also prevent them from making the right decisions at the right time. Read our article on why it's essential to get pricing right.
-

Article 7 mins
How Academic Research Can Help Drive Climate Risk Resilience
By leveraging the advances made by academic research, companies can develop more robust climate risk resilience.
-
Article 6 mins
How Companies Are Using Climate Modeling to Improve Risk Decisions
Climate modeling has been around for decades but mainly used by academic and government scientists. Led by the risk industry, the private sector is adapting these models to broadly assess the physical impacts of climate change.
-
Article 9 mins
Record Heatwaves: Protecting Employee Health and Safety
With the continued threat of rising temperatures, companies should focus on building climate and weather-related impacts into their overall workforce resilience plans.
-
Article 9 mins
Addressing the Wellbeing Disconnect With a Data-Informed Strategy
Companies recognize that wellbeing is more important than ever. But the programs they offer don’t always match what their employees need.
-

Article 4 mins
Retirement Planning: Transitioning to SECURE 2.0
SECURE 2.0 is changing retirement planning for businesses and employees. Strategic decisions will be critical in building sustainable retirement plans.
-

Article 6 mins
Driving Innovation and Strategic Financial Decisions Through ESG Regulation
Not only does ESG regulation have the potential to make or break an M&A deal, but failure to comply could also significantly damage a business.
-
Article 10 mins
Designing Tomorrow: Personalizing EVP, Benefits and Total Rewards
Companies are increasingly turning to personalization to keep up with workforce changes and deliver value to their employees.
-
Article 10 mins
Navigating the New EU Directive on Pay Transparency
In a move designed to close the gender pay gap, the European Commission is increasing pay transparency across member states. Prepare your firm now for potential implications and opportunities.
-

Article 7 mins
Using Climate Data for Better Business Decisions
Innovation in data, analytics and risk transfer solutions enables Aon to help clients accelerate their investments in decarbonization and climate resiliency and support the transition to a lower-carbon economy.
-
Article 5 mins
The Future of Food: Balancing Risk and Opportunity
Alternative proteins and farming methods may be the future of food, but stakeholders must be aware of the risks that come with these opportunities.
-
Article 4 mins
Four Steps to Develop Strong Property Risk Coverage in a Hardening Market
With the property market remaining volatile, risk buyers need a solid strategy to stabilize their risk portfolio.
-
Article 6 mins
Parametric Insurance: A Complement to Traditional Property Coverage
Many risk buyers remain challenged to find adequate coverage to address a growing protection gap, especially for their cat-prone exposures and other risks. Parametric is an alternative solution that has grown in utilization to insure against a variety of perils in any market conditions.
-
Article 6 mins
To Combat Cyber Risk, Businesses Invest in Resilience
Cyber security is a growing business concern, but many companies still need to improve their cyber resilience in key areas. Aon’s 2023 Cyber Resilience Report explores how global industries are protecting themselves against cyber threats.
-
Article 8 mins
Cultural Alignment Planning Drives M&A Success
A strong people strategy and robust change management and communication approach will drive better cultural alignment during M&A deals — ultimately increasing the chance for success.
-
Article 8 mins
Using Parametric Insurance to Match Capital to Climate Risk
Risk managers are rethinking their risk resilience by turning to parametric insurance, an “if-then” model designed to complement and supplement a traditional indemnity program and better match capital to the broad nature of risk caused by natural disasters.
-
Article 8 mins
Collective Retirement Plans Create Value in a Changing Landscape
Employer-provided retirement programs have become more complex to administer. Collective plans can help to ease the burden.
-

Article 10 mins
Value-Led Approaches to Reduce Healthcare Costs in the U.S.
An alarming number of insured Americans still can’t afford healthcare treatment, but there are approaches employers can take to reduce costs and improve outcomes for employees and their families.
-
Article 14 mins
Cutting Supply Chains: How to Achieve More Reward with Less Risk
Unexpected global changes have shaken supply chains, exposing the fragility of a complex system. While some businesses search for stability, others are harnessing the power of improved data, analytics and AI to strengthen their resilience and opportunities for growth.
-
Article 8 mins
Decarbonizing Your Business: Finding the Right Insurance and Strategy
Lowering greenhouse gas emissions is a growing priority, but successful industrial decarbonization requires a clear view of regulations and risk.
-

Article 5 mins
Three Opportunities to Strengthen Your Workforce Strategy with Talent Assessment
In a tight labor market, people leaders are relying more on talent assessments for pre- and post-hire candidates. The resulting data and insights lead to more informed hiring and retention decisions.
-

Article 6 mins
New Standards Issued for Global Climate Risk Disclosure
New standards from the IFRS Foundation’s International Sustainability Standards Board (ISSB) add expectations for companies to disclose more stringent climate risk and oversight information, as well as greenhouse gas emissions data.
-
Article 6 mins
A Framework for Navigating Volatility in a Complex Environment
As the risk landscape expands, every TMC business should consider developing a robust framework for operational resilience. A three-phase strategy provides a rational approach to building a framework to help understand and manage key risk concerns and minimize business disruptions.
-

Article 6 mins
Wildfires Underscore Urgent Need for Climate Contingency Plans for Employees
Working together across an organization to build a contingency plan for dangerous climate events is crucial to ensuring everyone is protected.
-
Article 7 mins
Making Wellbeing Part of a Company’s DNA
Wellbeing strategy, once seen as a luxury, is now a vital part of a company’s overall strategy. Integrating wellbeing into other areas of a company is the next step forward.
-
Article 10 mins
How Data and Analytics Can Optimize HR Programs
Pressure to reduce costs in response to a challenging economic environment highlights the pivotal role data and analytics can play in optimizing business investment in talent and future growth.
-
Article 9 mins
Organizational Design and Talent Planning are Key to M&A Success
M&A deals are among the most challenging events a business can navigate. Effective organization design and talent planning are critical to ensure a smooth transition.
-
Article 7 mins
Case Study: The LPGA Unlocks Talent Potential with Data
The LPGA shares how data technology has helped to pinpoint the personality traits of top players, leading to success on and off the golf course.
-

Article 6 mins
How Companies Can Prepare for ESG Risks and Regulatory Changes Across the Globe
Resilience and growth are dependent on business leaders taking action to respond to ESG risk and opportunities.
-
Article 6 mins
Four Ways to Increase the ROI of Your Benefits Strategy With Technology
Return on investment is one of the biggest considerations in implementing employee benefits. This is more pertinent as global economic volatility forces companies to balance costs with expectations.
-
Article 7 mins
COVID-19 has Permanently Changed the Way We Think About Wellbeing
Aon’s 2022–2023 Global Wellbeing Survey explores what employers around the world are doing to support the needs of today’s workforce.
-
Article 5 mins
Project Management for HR: The Secret Behind a Successful M&A Deal
During a complex M&A deal, centralized project management helps keep human resources workstreams connected to ensure successful post-deal outcomes.
-
Article 12 mins
Rethinking Risk: Navigating Energy Volatility in Heavy Industry
The rising cost of energy is driving leaders in the heavy industries to rethink their approach to risk.
-
Article 6 mins
Rethinking Your Total Rewards Programs During Mergers and Acquisitions
Business leaders should take a close look at their reward programs during a merger or takeover to help retain talent and ensure a cohesive pay strategy.
-
Article 7 mins
How to Futureproof Data and Analytics Capabilities for Reinsurers
Now more than ever, the reinsurance industry needs insight. But it is still slow to implement advanced data and analytics.
-
Article 15 mins
Get Ready for the Top 5 HR Trends in 2023
HR can make an impact in a business by identifying the forces creating instability and linking HR processes.
-

Article 13 mins
Reducing Finance Risks in a Fast-Moving Wind Energy Market
The renewable energy industry is facing unique headwinds, but there are opportunities to accelerate the role of European onshore and offshore wind power.
-

Article 4 mins
3 Ways Insurance Industry Can Accelerate Net Zero by Facilitating Capital
Insurers can help advance a climate crisis solution. Here are three ways the industry can help accelerate the journey to net zero emissions.
-

Article 7 mins
Catastrophes and Coverage: What 2022 Can Teach Us About Climate Risk
The impact of climate change on businesses, insurers, and communities can provide insight on how to mitigate the risks associated with extreme weather events.
-

Article 11 mins
Client Alert: Responding to Bank Failures
Following a tumultuous two weeks in the banking sector and subsequent volatility to global banking markets, depositors and affected third parties are having to rapidly assess, and respond to, a range of risk management, liquidity and human capital challenges.
-

Article 5 mins
Technology Revolutionizes Real-Time Modeling and Response
Facing natural disasters, advanced weather and catastrophe modeling can help companies prepare — often resulting in quicker claims processing and response.
-
Article 5 mins
How Climate Science Unites with Technology to Drive a More Resilient World
Academic research collaboration with the insurance industry enhances understanding and creates actionable climate change insights.
-

Article 6 mins
How the Right ESG Approach Makes an Impact On Your Talent and Your Business
ESG strategies are becoming a key part of the corporate landscape as executives and investors use new metrics to assess a company's long-term success.
-

Article 6 mins
Net-Zero Goals and Climate Change Realities: Leaders Weigh In
Experts discuss the challenges and opportunities faced by organizations in their journey to net-zero in the Aon Insights Series 2022 in London.
-

Article 6 mins
How Organizations Can Find a Path to Net Zero
The goal of achieving ‘net zero’ emissions is gaining momentum as a solution to climate change.
-

Article 11 mins
Preparing for a US IPO: 5 Actions to Take Now
How can private companies best prepare the ground for a successful US IPO?
-

Article 7 mins
Preparing for Recession: Steps to Protect a Business
A report by Aon has advised businesses to prepare for a recession by evaluating their workforce, markets and investments.
-

Article 6 mins
Cryptocurrency and the Metaverse: Building the Foundation for a Virtual Marketplace
Accompanying the considerable growth and potential, there is a long list of risks associated with the cryptocurrency and metaverse markets.
-

Article 4 mins
Q&A: As Inflation Surges, New Business Strategies Emerge
Inflation caused by economic uncertainty and supply chain disruptions has impacted businesses and consumers globally.
-

Article 10 mins
Tackling Climate Change by Investing in Biodiversity
By investing in biodiversity alongside other climate strategies, companies can find new opportunities and manage risk.
-

Article 5 mins
The NFT Market Is Growing Rapidly — And So Are the Fraud Risks
NFTs are digital ownership records that are verified using blockchain technology and can be tied to works of art, collectibles and other intellectual property.
-
Article 8 mins
Reputation Analytics as a Leading Indicator of ESG Risk
Reputation analytics are a powerful predictive tool in gauging near-term ESG risk exposures.
-

Article 6 mins
Who’s Got Hold of Your Personal Information? Data Brokers Are Big Business
Data brokers are companies that collect and sell personally identifiable information to third parties. This industry has become a multibillion-dollar industry, but it also presents risks to individuals and businesses whose personal information may be used for nefarious purposes.
-

Article 6 mins
The Russia-Ukraine Conflict Will Have a Major and Long-Lasting Impact on Global Food Supply
Because Russia and Ukraine are responsible for a significant share of the world's wheat, barley, corn and oil seed, the conflict will have significant consequences on global food supply and prices.
-

Article 7 mins
Aon CEO Greg Case: Success in a World of New and Increasingly Volatile Risks
In this interview, Greg Case, the CEO of Aon, discusses the challenges that businesses are facing due to the pandemic, cyber risks, and the impacts of climate change.
-
Article 6 mins
How Credit Insurance Can Help Businesses Make Better Strategic Decisions
Credit insurance allows businesses to protect income streams and build resilience. Read more about the different types of credit insurance models.
-
Article 6 mins
As New Technologies Emerge, Can Businesses Find the Right Opportunities to Outsource Innovation?
As the global economy becomes increasingly complex, the need for an organization to innovate is brought into sharper focus.
-

Article 5 mins
Valuing the Virtual: Are Non-Fungible Tokens Fad or Future?
The rise of non-fungible tokens has created new markets.
-

Article 8 mins
Listen: The Pandemic Widens Retirement Gap for Women
From working on the front lines and extra childcare needs to losing jobs, women are bearing the brunt of COVID-19’s impact on the workforce.
-

Article 3 mins
The Details of Data: Using Technology for Better Analysis
How technology can help solve the difficulties organizations face analyzing data
-
Article 7 mins
Why Workforce Wellbeing is Vital to Company Performance
Employee wellbeing has a direct impact on company performance and customer satisfaction.
-

Article 6 mins
Succession Starts at Onboarding: Lessons From Law Firms
Businesses that rely on client relationships face challenges in succession planning as key employees retire or leave the firm.
-

Article 5 mins
What A Stuck Ship in the Suez Canal Teaches Us About Supply Chain Risks
The Suez Canal blockage highlighted the importance of businesses understanding their supply chains and finding weak links to reduce risks.
-

Article 7 mins
Navigating the Future of Work with AI
Artificial intelligence is changing the way businesses operate. As its use becomes more widespread, leaders need to understand how this technology works and what its future role may be.
-

Article 7 mins
The 10 Factors That Fuel a Resilient Workforce
Building a resilient workforce for businesses is more important than ever — particularly in the context of the COVID-19 pandemic.
-

Article 6 mins
What You Need to Know About Pay Transparency and How it’s Changing the Workplace
The move toward greater pay transparency will have an impact on the salary considerations of employers and employees alike.
-

Article 6 mins
The 6 Elements of Good Judgment For Better Decisions
This article discusses the importance of good judgment in leaders when making crucial decisions for their organizations.
-

Article 4 mins
Small Farmers, Big Impact: Empowering Business and Community
In Uganda and Rwanda, hundreds of small farmers are producing coffee and tea but can’t gain access to major international markets to sell their crops.
-

Article 5 mins
Resilience in Unprecedented Times: The Red Cross and Aon Partnership
Aon and Red Cross have joined forces to help communities become more resilient to natural disasters, climate change and public health crises.
-

Article 9 mins
Make Way For The Middle Market: An Economic Growth Engine
Middle-market businesses — companies with $10 million to $1 billion in annual revenue — play a vital role in driving global economic growth.


